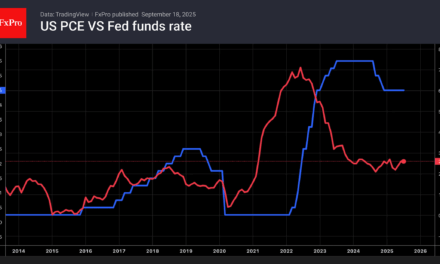
EURUSD on the daily chart
The EURUSD is under pressure and extending to the downside, falling to new lows not seen since June 26. That date marked a bullish breakout above a key swing area on the daily chart between 1.1663 and 1.1691—a zone that had previously served as strong support/resistance going back to April through November 2021, as highlighted by the red numbered circles on the above daily chart.
Since the June 26 breakout last month, price action had remained comfortably above that swing area, suggesting bullish control. However, today’s move lower challenges that narrative, as the pair pushes back below the lower edge of the 1.1663–1.1691 range, signaling potential weakness and a shift in sentiment.
Looking at the hourly chart, a break below 1.1663 opens the door to a series of downside targets. The next key support comes in at the 1.1614–1.1629 swing area, which served as a short-term floor earlier in the month. Below that, traders will be eyeing the 1.15688–1.15780 zone, followed by the more significant 38.2% Fibonacci retracement level of the move up from the April low, which sits at 1.1535.
Should bearish momentum continue, these levels may attract interest from both sellers looking to extend the move and buyers seeking potential support zones. For now, a break of the 1.1663 level would mark a technical warning sign for bulls and could shift the near-term bias back toward the downside.
Conversely, hold support here at 1.1663, and snap back above the 1.1693 would disappoint the sellers looking for the break back to the downside.
ForexLive.com
is evolving into
investingLive.com, a new destination for intelligent market updates and smarter
decision-making for investors and traders alike.