
- US adds 177K jobs in April, beating forecasts but trailing March’s revised print of 185K.
- Trump pressures Fed to cut rates, though data may delay policy shift until July.
- UK manufacturing PMI contracts again; BoE seen cutting rates by 25 bps next week.
The Pound Sterling (GBP) is advancing for the first time in the last four days and bounced off weekly lows against the Greenback, although an upbeat jobs report in the United States (US) decreased fears of a recession in the largest economy. Nevertheless, the US Dollar (USD) failed to gain ground, as depicted by GBP/USD trading at 1.3321, up 0.39%.
GBP/USD surges as easing US-China tensions weigh on Dollar despite upbeat NFP and factory orders
Positive trade news improved the risk appetite as China-US tensions are easing and weighing on the US Dollar. April’s US Nonfarm Payrolls rose by 177K, exceeding forecasts of 130K, though they came short of the downwardly revised March figures of 185 K. The Unemployment Rate stood at 4.2%, and the data might deny the Federal Reserve (Fed) from cutting interest rates.
After the data, US President Donald Trump demanded that the Fed lower rates via a post on his Truth Social Network.
Other data from the US revealed that Factory Orders in March rose by 4.3% Month over Month, up from 0.5% the previous month but slightly below the 4.5% foreseen.
In the UK, the latest S&P manufacturing report revealed the tariff’s impact on the economy, as the PMI contracted for the seventh month in a row in April. Next week, the Bank of England (BoE) is expected to deliver a 25 basis points (bps) rate cut, according to the swaps markets.
Hence, GBP/USD could come under pressure as the interest rate differential between the US and the UK could benefit the former as the Fed is projected to lower rates until the July meeting.
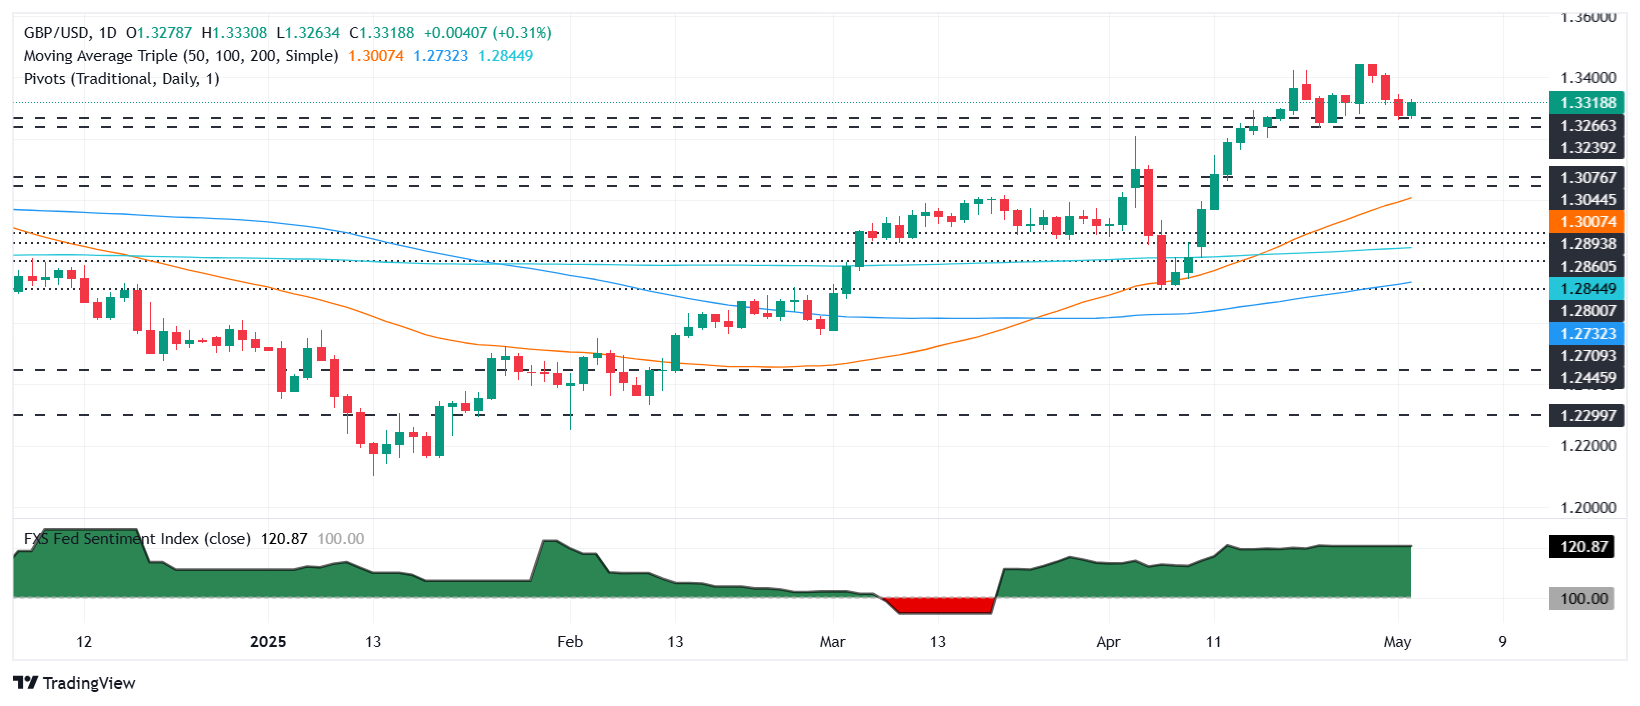
GBP/USD Price Forecast: Technical outlook
The GBP/USD seems to be forming a ‘bullish harami’ two-candle chart pattern, indicating that there’s some acceptance for higher prices. Still, the pair must surpass the May 1 high at 1.3345 to confirm the pattern, and bulls could push the spot price toward 1.3400. A breach of the latter will expose the year-to-date (YTD) high of 1.3443.
Conversely, if GBP/USD slides beneath 1.33, key support levels will be exposed. The first would be the 1.3200 mark, followed by the 1.3100 figure and the 50-day Simple Moving Average (SMA) at 1.3004.
British Pound PRICE This week
The table below shows the percentage change of British Pound (GBP) against listed major currencies this week. British Pound was the strongest against the Japanese Yen.
| USD | EUR | GBP | JPY | CAD | AUD | NZD | CHF | |
|---|---|---|---|---|---|---|---|---|
| USD | 0.03% | -0.03% | 0.35% | -0.65% | -0.99% | -0.19% | -0.60% | |
| EUR | -0.03% | -0.12% | 0.31% | -0.70% | -1.11% | -0.23% | -0.65% | |
| GBP | 0.03% | 0.12% | 0.44% | -0.56% | -1.01% | -0.11% | -0.52% | |
| JPY | -0.35% | -0.31% | -0.44% | -0.97% | -1.30% | -1.93% | -0.69% | |
| CAD | 0.65% | 0.70% | 0.56% | 0.97% | -0.47% | 0.46% | 0.06% | |
| AUD | 0.99% | 1.11% | 1.01% | 1.30% | 0.47% | 0.90% | 0.48% | |
| NZD | 0.19% | 0.23% | 0.11% | 1.93% | -0.46% | -0.90% | -0.41% | |
| CHF | 0.60% | 0.65% | 0.52% | 0.69% | -0.06% | -0.48% | 0.41% |
The heat map shows percentage changes of major currencies against each other. The base currency is picked from the left column, while the quote currency is picked from the top row. For example, if you pick the British Pound from the left column and move along the horizontal line to the US Dollar, the percentage change displayed in the box will represent GBP (base)/USD (quote).