- Pound Sterling hit a seven-week low versus the US Dollar after failing to hold above 1.3500.
- GBP/USD traders gear up for a barrage of US labor data heading into the final quarter of 2025.
- Technically, GBP/USD eyes more downside as the 50-day SMA support caves in amid a bearish daily RSI.
The Pound Sterling (GBP) reversed early recovery gains and turned negative on the week against the US Dollar (USD), smashing GBP/USD to seven-week lows below 1.3350.
Pound Sterling downside opened up
A broad-based US Dollar resurgence, combined with a cautious risk tone throughout the week and disappointing UK business PMI surveys, helped Pound Sterling sellers to strengthen their control.
Markets pared back their bets for aggressive US Federal Reserve (Fed) interest rate cuts this year, in light of encouraging economic data and cautious Fed commentary.
This shift in the sentiment surrounding the Fed easing expectations powered the USD recovery against its six major rivals.
New Fed Governor Stephen Miran said on Monday that the Fed is misreading how tight it has set monetary policy and will put the job market at risk without aggressive rate cuts.
Meanwhile, Fed policymakers Raphael Bostic, Beth Hammack, and Thomas Barkin maintained their cautious rhetoric on further easing amid looming upside risks to inflation.
On Tuesday, Fed Chair Jerome Powell, in his speech at the Greater Providence Chamber of Commerce in Rhode Island, stuck to the cautious rhetoric, providing little hints on the path of interest rate cuts.
“Chair Powell in his speech emphasised that ‘near-term risks to inflation are tilted to the upside and risks to employment to the downside’, highlighting the challenges of balancing the Fed’s dual mandate in the current environment,” Westpac analysts explained in a research note.
Markets paid limited attention to the S&P Global US preliminary PMI data, which came in mixed for September. The S&P Global Composite PMI eased to 53.6 from 54.6 in August, signalling continued expansion but at a weaker pace.
However, the below forecast S&P Global preliminary PMI data exerted bearish pressure on the British Pound. Economic activity in the UK’s private sector expanded at a softer pace in September than in August, with the S&P Global Composite Purchasing Managers’ Index (PMI) declining to 51 from 53.5. This reading came in worse than the market expectation of 52.7.
The declines in GBP/USD accelerated in the second half of the week after the USD capitalized on a fresh batch of mid-tier US data, underlining the US economic resilience and pouring cold water on aggressive Fed easing expectations.
US Gross Domestic Product rose by an upwardly revised rate of 3.8% from April through June, higher than 3.3% initially reported.
Meanwhile, the Labour Department reported 218,000 seasonally adjusted filings for the week ending September 20, down 14,000 from the prior week’s upwardly revised figure and below the consensus estimate of 235,000.
Additionally, Durable Goods Orders rebounded firmly by 2.9% in August versus the previously revised -2.7% and -0.5% expected.
On Friday, traders eagerly awaited the release of the US core Personal Consumption Expenditures (PCE) Price Index, the Fed’s preferred inflation measure, for fresh hints on whether the Fed will remain on track for two rate cuts this year.
Traders also weighed the latest tariff announcements from US President Donald Trump. Trump on Thursday announced tariffs of up to 100% on imports of branded and patented pharmaceutical drugs, starting October 1. Trump also slapped 50% tariffs on imports of kitchen cabinets and bathroom vanities, 30% on upholstered furniture, and 25% on heavy trucks.
The US Bureau of Economic Analysis reported on Friday that the core PCE Price Index rose by 2.9% on a yearly basis in August. This print matched July’s increase and came in line with the market expectation, failing to trigger a noticeable market reaction. Nevertheless, the improving risk mood made it difficult for the USD to preserve its strength heading into the weekend and helped GBP/USD hold its ground.
Week ahead: US labor data to steal the show
It’s data-busy week, packed with top-tier employment data from the United States (US), trickling in from Tuesday.
US Pending Home Sales will be the only data reported on Monday.
Tuesday will feature the US JOLTS Job Openings Survey alongside speeches from the Fed and BoE policymakers.
On Wednesday, the US ADP Employment Change data will be released, followed by the ISM Manufacturing PMI. The final S&P Global Manufacturing PMI data from both sides of the Atlantic will hold little relevance.
The weekly US Jobless Claims will entertain traders on Thursday as they gear up for the critical US Nonfarm Payrolls report on Friday.
The US ISM Services PMI and BoE Governor Andrew Bailey’s speech will follow, heading into the weekend.
Meanwhile, traders will pay close attention to speeches from Fed policymakers along with any fresh developments on the geopolitical and trade front.
GBP/USD: Technical outlook
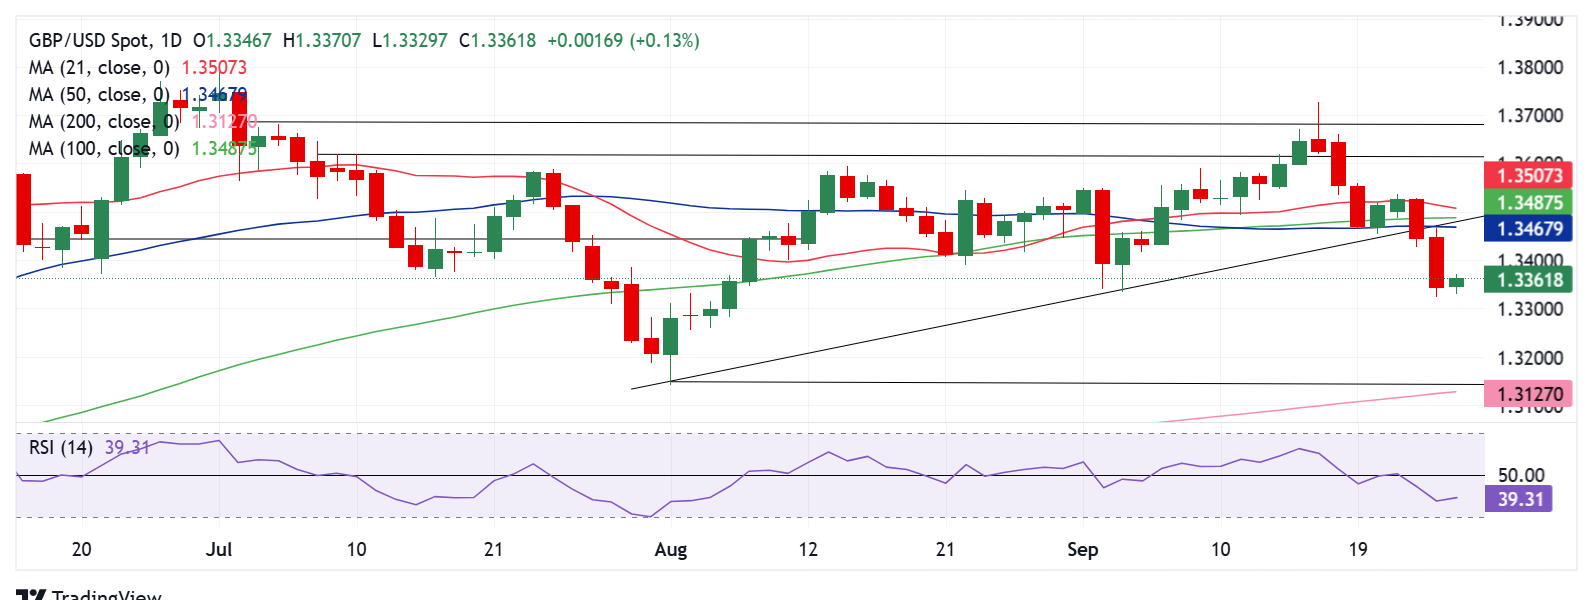
As observed on the daily chart, GBP/USD resumed its previous week’s downtrend after having failed to hold above the 21-day Simple Moving Average (SMA), now at 1.3509, on multiple occasions.
The rejection above the 21-day SMA or the 1.3500 level paved the way for bigger declines, as the pair pierced through the critical 100-day SMA and 50-day SMA supports at 1.3487 and 1.3468, respectively.
In doing so, the pair closed Wednesday below the rising trendline support, then at 1.3462.
The sell-off gathered strength thereafter, as sellers targeted the 1.3300 barrier.
If the downside resumes, the 1.3300 round level will offer initial support, below which the August 4 low of 1.3254 will be tested.
Further south, the August low of 1.3142 could come to the rescue of buyers, below which the 200-day SMA at 1.3127 could be attacked.
The 14-day Relative Strength Index (RSI) remains well below the midline, keeping the bearish potential intact in the pair.
In order to initiate any meaningful recovery, GBP/USD must find acceptance above the confluence resistance zone at around 1.3475, where the 50-day SMA, 100-day SMA and the rising trendline support-turned-resistance coincide.
The next relevant topside hurdles align at the 21-day SMA, now at 1.3509, followed by the 1.3600-1.3620 supply area.
A sustained move above the latter will expose the July 4 high of 1.3681 on the way to 1.3788 (July 1 high).
Economic Indicator
Nonfarm Payrolls
The Nonfarm Payrolls release presents the number of new jobs created in the US during the previous month in all non-agricultural businesses; it is released by the US Bureau of Labor Statistics (BLS). The monthly changes in payrolls can be extremely volatile. The number is also subject to strong reviews, which can also trigger volatility in the Forex board. Generally speaking, a high reading is seen as bullish for the US Dollar (USD), while a low reading is seen as bearish, although previous months’ reviews and the Unemployment Rate are as relevant as the headline figure. The market’s reaction, therefore, depends on how the market assesses all the data contained in the BLS report as a whole.