
- The Pound Sterling recovered from 14-month lows of 1.2100 versus the US Dollar.
- GBP/USD braces for Trump 2.0, UK labor data and global preliminary PMI reports.
- Technically, the pair looks vulnerable as the daily RSI remains bearish.
The Pound Sterling (GBP) paused its downtrend against the US Dollar (USD), fuelling a tepid GBP/USD recovery from 14-month lows of 1.2100.
Pound Sterling bounced on US Dollar correction
This week, it was all about the inflation data from the United Kingdom (UK) and the United States (US). However, the US inflation data-led renewed dovish expectations surrounding the Federal Reserve (Fed) fuelled a sustained correction in the USD and the US Treasury bond yields from over one-year highs. The broad US Dollar softness allowed the GBP/USD pair to sigh relief after hitting a fresh 14-month low at 1.2100 to begin the week.
Earlier in the week, the US Consumer Price Index (CPI) rose in line with estimates at an annual rate of 2.9% in December from November’s 2.7%. However, core CPI, which excludes food and energy prices, rose by 3.2%, below forecasts of 3.3%. Meanwhile, the US annual Producer Price Index (PPI) rose 3.3% in December, missing the expected 3.4% growth.
Tame US inflation figures revived expectations that the Fed would remain on track for two interest rate cuts this year. Markets now predict the Fed will deliver 37 basis points (bps) worth of rate cuts by year-end, compared with about 30 bps before the inflation data. Dovish commentaries from the Fed policymakers also contributed to markets piling up on Fed rate cut bets.
However, the GBP/USD recovery faced headwinds from increased bets of interest rate cuts by the Bank of England (BoE) this year, courtesy of the surprise UK inflation cooldown and weak Retail Sales data for December. The UK annual CPI rose 2.5% in the year to December, down from 2.6% the month before, the Office for National Statistics (ONS) said, missing the estimated 2.7% growth. Services inflation declined sharply to 4.4% YoY in December from November’s 5%.
The ONS said on Friday that British Retail Sales, adjusted for the inclusion of the Black Friday sales at the start of the month, fell by 0.3% in month-on-month (MoM) in December after a downwardly revised 0.1% expansion in November.
Further, investors’ nervousness before US President-elect Donald Trump’s inauguration on Monday, January 20, negatively affected the risk-sensitive Pound Sterling. Concerns over the impact of Trump’s potential policies on inflation and the economy remained as an underlying drag on broader market sentiment.
Week ahead: Trump returns to the White House
GBP/USD traders are preparing for a critical week as US President-elect Donald Trump returns to the White House, inaugurating his second term on Monday.
Trump’s policy announcements will be closely scrutinized as they will have a lasting impact on broader market sentiment and risk-sensitive assets such as the Pound Sterling.
Though it will be a holiday-shortened week, it is anticipated to be more volatile. US markets will remain closed on Monday in observance of Martin Luther King Jr. Day.
Tuesday will feature only the UK employment data, while there will be no top-tier economic data releases from either side of the Atlantic on Wednesday.
Therefore, attention will turn to the US weekly Jobless Claims data due on Thursday ahead of Friday’s S&P Global preliminary UK and US Manufacturing and Services PMI data.
The annual World Economic Forum (WEF) meetings will remain in the spotlight alongside data publication. The event will be held in Davos from January 20 to 24 and will be attended by several global leaders, including central bankers, heads of state, and business leaders.
It’s worth noting that there will be no public appearances from Fed policymakers as they enter the ‘blackout period’ on Saturday ahead of the January 28-29 policy meeting.
GBP/USD: Technical Outlook
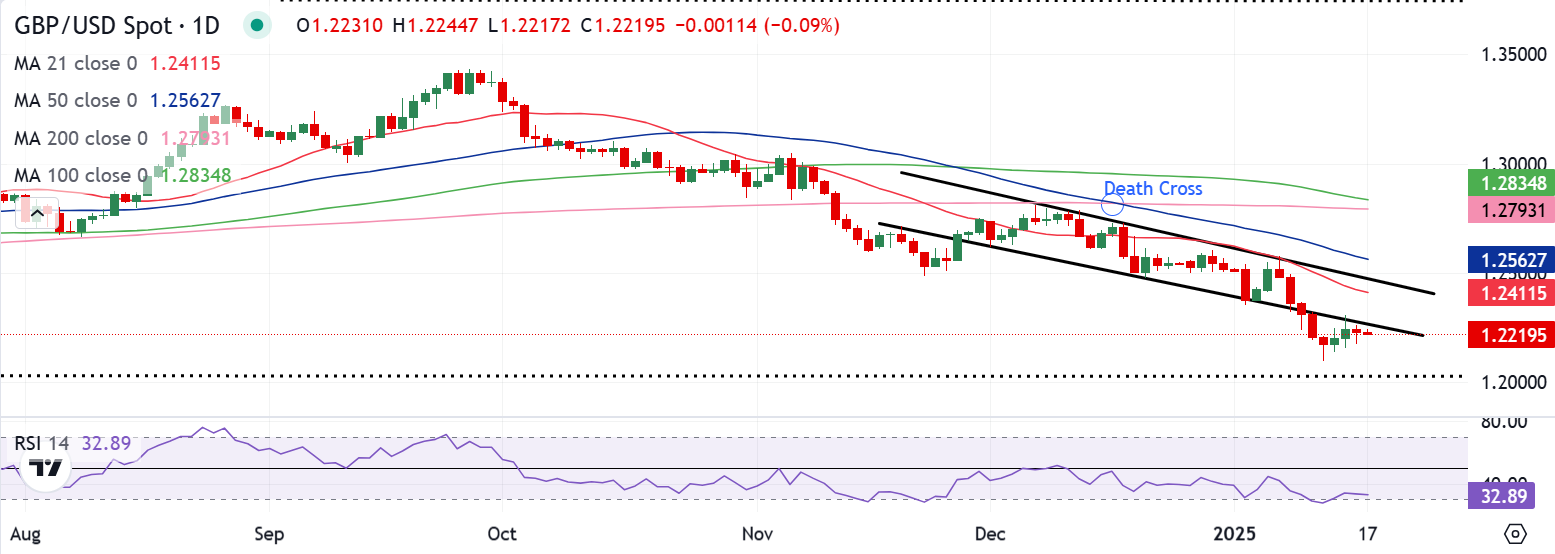
The daily chart shows that GBP/USD sellers hold the downside break from the six-week-long falling wedge formation confirmed a week ago.
The 14-day Relative Strength Index (RSI) has bounced off the oversold region but remains below the midline, currently near 33. The leading indicator suggests that any rebound in the major is likely to be met with a strong supply force.
Adding credence to the bearish potential, the 100-day Simple Moving Average (SMA) is approaching the 200-day SMA from above. If the 100-day SMA pierces through the latter to the downside on a daily closing basis, a Bear Cross could be validated.
If sellers regain poise, the pair could revisit the 14-month low of 1.2100 before further downside opens up toward the 1.2050 psychological level and the October 2023 low of 1.2037.
A sustained break below that level will trigger a fresh downtrend toward the 1.1900 level.
Conversely, acceptance above the 21-day SMA at 1.2411 is critical to initiate a meaningful recovery toward the 50-day SMA at 1.2562.
Ahead of that, the upper boundary of the wedge at 1.2487 could challenge the bearish commitments.