
- Gold retreats from the all-time peak after struggling to find acceptance above the $3,500 psychological mark.
- A solid USD recovery turns out to be a key factor that prompts profit-taking around the safe-haven commodity.
- Traders now look forward to the month-start US macro releases for some meaningful directional impetus.
Gold extends its intraday retracement slide from a fresh all-time peak and slides to the lower end of the daily range, around the $3,470 region during the first half of the European session on Tuesday. The US Dollar (USD) catches aggressive bids and rallies to a four-day high amid a selloff in the global bond markets. This prompts some profit-taking around the commodity amid slightly overbought conditions on short-term charts.
Given that the markets have fully priced in an interest rate cut by the Federal Reserve (Fed) this month, the aforementioned negative factor backs the case for some meaningful corrective decline in the Gold price. However, a turnaround in the global risk sentiment could offer some support to the safe-haven commodity. Traders might also refrain from placing aggressive bets and opt to wait for this week’s important US macro releases.
Daily Digest Market Movers: Gold attracts intraday sellers amid a solid USD recovery
- Rising bets that the Federal Reserve will cut interest rates this month push the Gold price higher for the sixth straight day, to levels beyond the $3,500 psychological mark or a fresh all-time peak during the Asian session on Tuesday.
- US Treasury Secretary Scott Bessent defended US President Donald Trump’s decision to fire Fed Governor Lisa Cook over allegations of mortgage fraud. Moreover, Trump has criticised Fed Chair Jerome Powell for not lowering rates.
- This adds to worries about the Fed’s independence, which might keep a lid on any attempted US Dollar recovery from the vicinity of August monthly swing lows, retested on Monday, and further benefit the non-yielding yellow metal.
- A US federal appeals court ruled on Friday that Trump’s reciprocal tariffs were illegal. Trump has made it clear the next stop will be the Supreme Court, adding a layer of uncertainty in the markets and underpinning the safe-haven bullion.
- An escalation of the conflict between Russia and Ukraine, and in the Middle East, keeps the geopolitical risks in play. This is seen as another factor lending support to the XAU/USD pair and backs the case for a further appreciating move.
- Traders now look forward to important US macro releases scheduled at the beginning of a new month, starting with the ISM Manufacturing PMI on Tuesday, for more cues about the Fed’s rate cut path and a fresh directional impetus.
- This week’s US economic docket also features JOLTS Job Openings on Wednesday, followed by the ADP report on private-sector employment and ISM Services PMI on Thursday, ahead of the Nonfarm Payrolls (NFP) report on Friday.
Gold corrective decline could find decent support near the $3,440 hurdle breakpoint
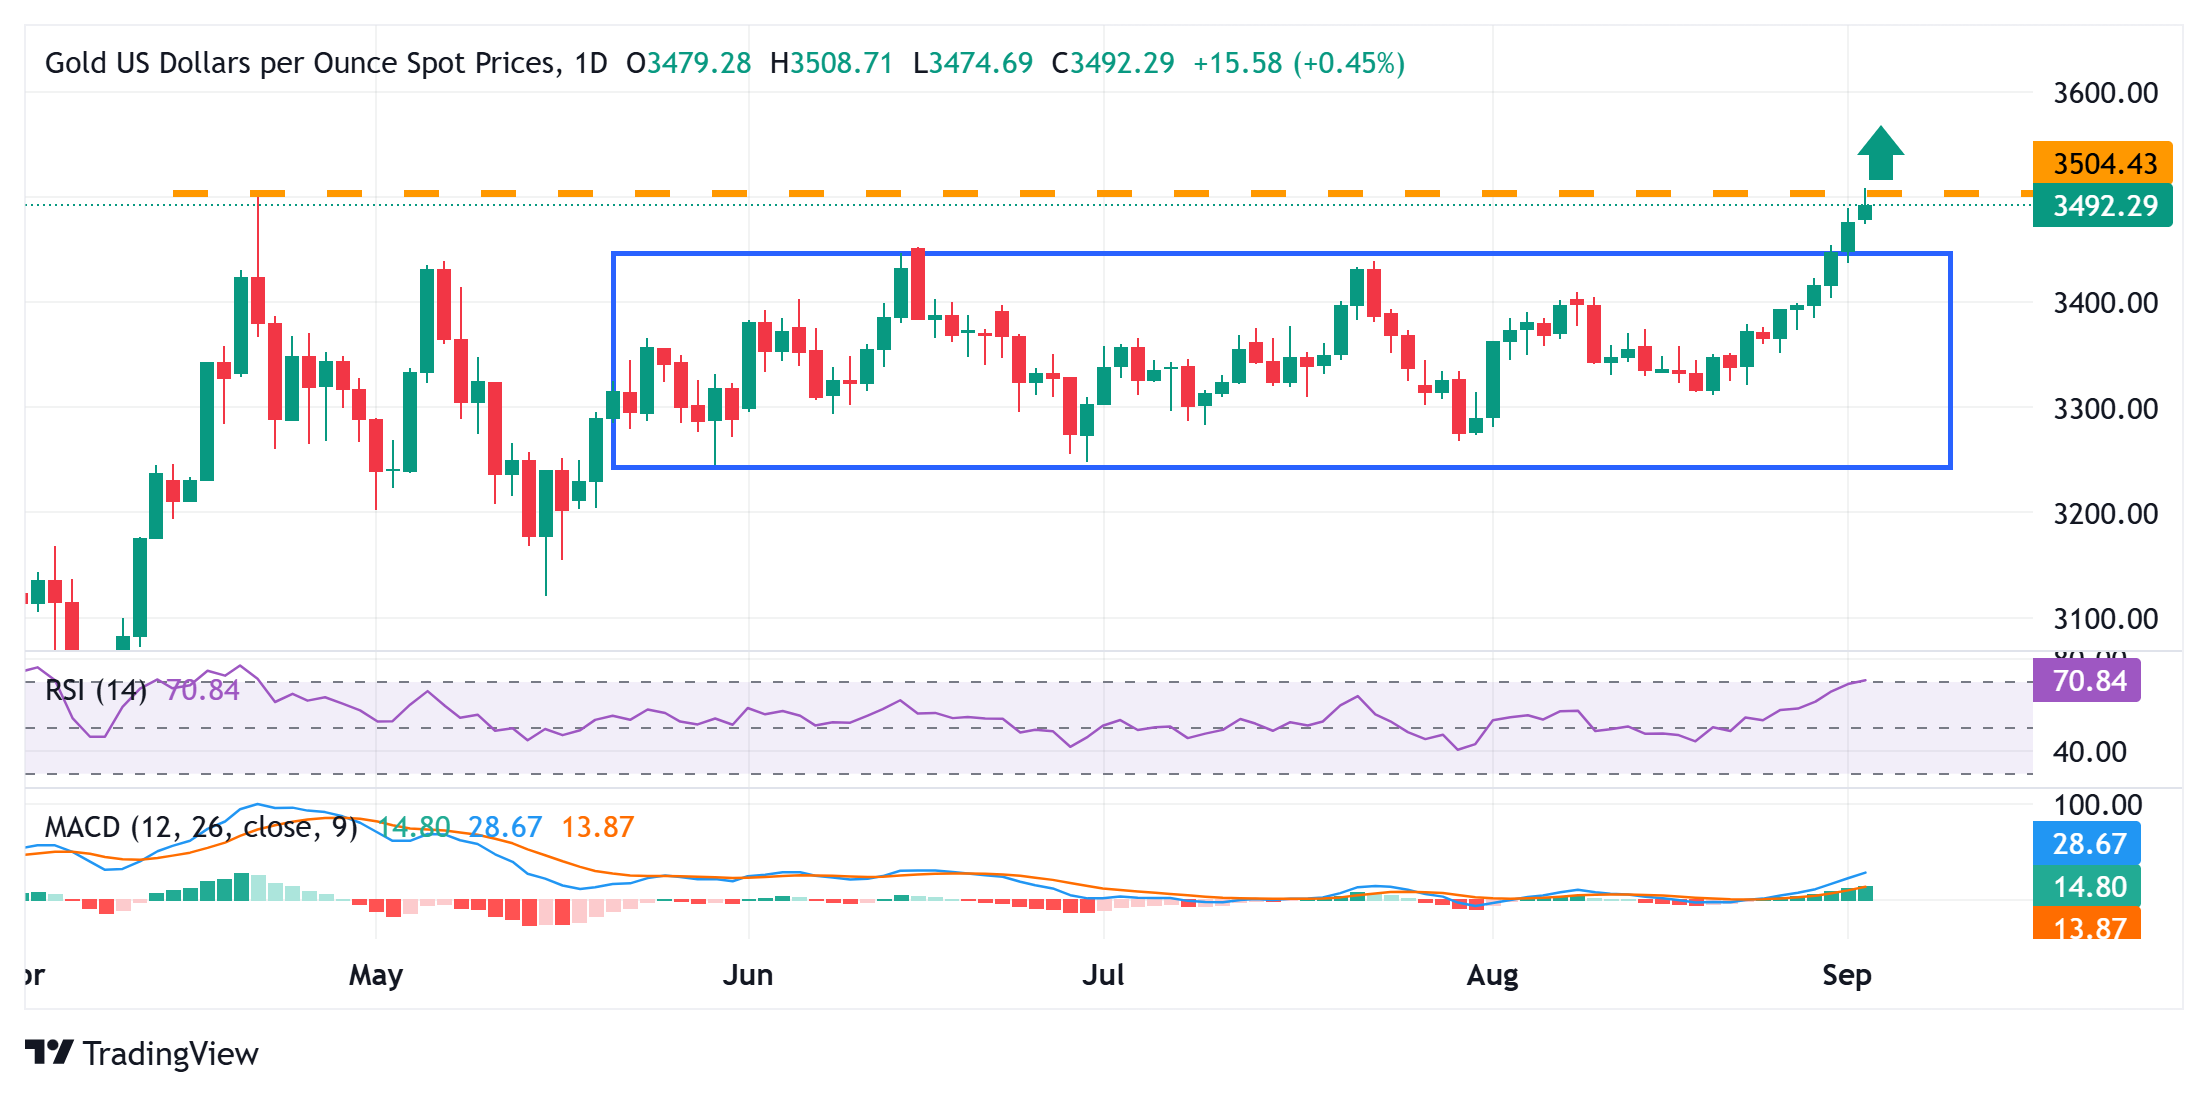
From a technical perspective, the recent breakout through the $3,440 heavy supply zone, representing the top boundary of a three-month-old trading range, was seen as a key trigger for the XAU/USD bulls. However, the daily Relative Strength Index (RSI) is already flashing slightly overbought conditions, which, along with failure to find acceptance above the $3,500 mark, warrants some caution. Hence, it will be prudent to wait for some near-term consolidation or a modest pullback before positioning for any further gains.
However, any meaningful corrective slide below the $3,475-3,474 area, or the Asian session low, is more likely to attract fresh buyers near the $3,440 resistance breakpoint. The latter should act as a key pivotal point, which, if broken decisively, might prompt some technical selling and drag the Gold price to the next relevant support near the $3,410-3,400 region.
US Dollar Price Today
The table below shows the percentage change of US Dollar (USD) against listed major currencies today. US Dollar was the strongest against the British Pound.
| USD | EUR | GBP | JPY | CAD | AUD | NZD | CHF | |
|---|---|---|---|---|---|---|---|---|
| USD | 0.57% | 1.11% | 0.98% | 0.21% | 0.70% | 0.84% | 0.42% | |
| EUR | -0.57% | 0.54% | 0.43% | -0.36% | 0.17% | 0.27% | -0.15% | |
| GBP | -1.11% | -0.54% | -0.08% | -0.88% | -0.40% | -0.26% | -0.68% | |
| JPY | -0.98% | -0.43% | 0.08% | -0.78% | -0.29% | -0.13% | -0.52% | |
| CAD | -0.21% | 0.36% | 0.88% | 0.78% | 0.47% | 0.66% | 0.21% | |
| AUD | -0.70% | -0.17% | 0.40% | 0.29% | -0.47% | 0.12% | -0.31% | |
| NZD | -0.84% | -0.27% | 0.26% | 0.13% | -0.66% | -0.12% | -0.42% | |
| CHF | -0.42% | 0.15% | 0.68% | 0.52% | -0.21% | 0.31% | 0.42% |
The heat map shows percentage changes of major currencies against each other. The base currency is picked from the left column, while the quote currency is picked from the top row. For example, if you pick the US Dollar from the left column and move along the horizontal line to the Japanese Yen, the percentage change displayed in the box will represent USD (base)/JPY (quote).