Want to learn how to identify market reversal points? The hammer candle is a classic candlestick pattern that signals a trend reversal from bearish to bullish.
In this article, you’ll learn how to spot the hammer and the inverted hammer on charts, trade using these patterns, and avoid false signals. Simple examples from Forex and cryptocurrency trading will show you how to use this pattern for profitable trades. Master candlestick analysis and start trading with confidence on a LiteFinance demo account!
The article covers the following subjects:
Major Takeaways
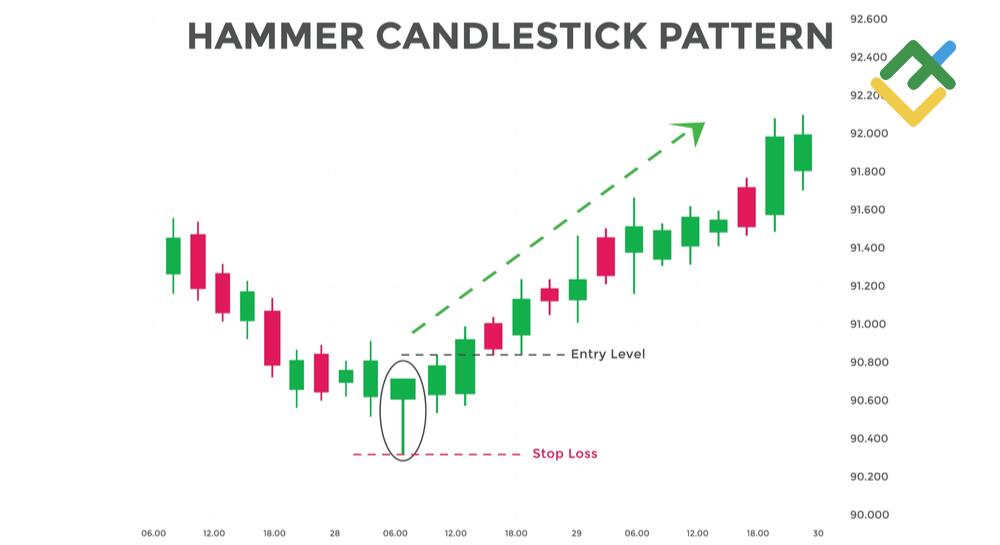
- The hammer is a bullish reversal pattern that appears at the bottom of a downtrend. It has a small body near the top, a long lower wick (2–3 times the body), and a short or absent upper wick.
- A bearish version of the hammer — called the hanging man — forms at the top of an uptrend and warns of a possible downward reversal. The candle color doesn’t matter, but a red one gives a stronger bearish signal.
- The inverted hammer is a reversal candle with a small lower body and a long upper wick. It signals a potential bullish reversal when found at the bottom of a trend. When it forms at the top, it indicates a potential bearish reversal and is called a shooting star.
- How to trade: Enter a trade after confirmation (e.g., a gap or the next bullish candle), set a stop-loss below/above the candle’s low/high, and take profit at support or resistance levels. Higher timeframes like H4 or D1 provide more reliable signals.
- Limitations: It’s recommended to confirm signals with indicators like RSI or MACD, or with support and resistance levels. Without such filters, false signals are more likely, especially on lower timeframes.
What is a Hammer Candlestick?
The hammer is candlestick with a small body and a long lower wick. The pattern is formed at the bottom after a downtrend. A candle signals the start of a new bullish rally for a particular instrument. This is a classic pattern that appears in the Forex, stock, cryptocurrency, commodity markets.
Description of a Hammer Candlestick
The hammer pattern appears on the chart during a price decline. It is a stop pattern that signals that the quotes have entered the buyers’ zone and the market has become bullish.
It is very easy to identify this pattern in the market. It should meet the following criteria:
-
a small body at the top of the price range;
-
green or red candle color. However, the green color signals a distinctive bullish trend in the market;
-
the longer the lower shadow, the stronger the bulls in the market.
In the classic pattern, the lower shadow should be at least twice as long as the body of the candle:
Hammer Candles in Technical Analysis
Using hammer candles in technical analysis, traders can identify potential points of a bullish price reversal at various time intervals. To do this, it is necessary to use a candlestick chart.
A Hammer candlestick is a strong signal, and when it appears, it is highly possible that the trend will reverse. Therefore, the hammer formation is a good reason to open long trades.
How to Trade on a Hammer Candlestick?
The higher timeframe the hammer pattern is situated at, the more important the reversal signal is.
Identifying such patterns on a chart is like winning the lottery, especially if the pattern appears on a daily or weekly chart.
This pattern is most often used in conservative strategies due to its importance on price charts.
Check out the article “How to Read Candlestick Charts?” to learn more about candlestick patterns and how to identify them.
Bullish Hammer
The green bullish hammer highlights the increase in the number of purchases and the appearance of the uptrend in the market.
Let’s look at a couple of examples of this signal on different timeframes.
The hourly EURUSD chart shows that before the start of the uptrend, several bullish hammers formed in a row at the bottom, which warned traders about a potential reversal.
The price movement up was equivalent to a downtrend.
After analyzing the EURUSD H4 chart at the same interval, it is clear that the asset has formed an H4 hammer. After that, the euro began to actively strengthen against the dollar.
Interestingly, the EUR rose even more than during the hourly chart analysis.
The larger timeframe a pattern appears at, the stronger the signal. Therefore, the potential profit becomes greater.
Summing up, smaller timeframes make it possible to determine a favorable entry point, while the larger ones show the approximate target for opening trades.
Bearish Hammer
The Bearish Hammer is a similar hammer reversal pattern but situated at the top. It is also called “the hanging man”. This is the same pattern as the Bullish hammer. However, when it appears at the top, an uptrend ends, and a downtrend begins.
The Bearish Hammer has a small candle body and an extended lower wick at least 2-3 times larger than the body itself. The candle’s color does not matter; it can be green or red.
Below is an analysis of the hanging man pattern on the BTCUSD H4 chart. The picture shows that after the pattern appeared at each of the local tops, BTCUSD was very actively declining at some points. Each pattern that appeared on the chart warned traders that the trend was ending and bearish resistance was hindering growth. Therefore, in these cases, it is important to exit the purchase and wait for confirmation of the reversal.
After the forecast about the start of a downtrend has been confirmed by additional instruments and patterns, it is possible to enter sales.
Inverted Hammer Candles
Inverted hammers are Japanese candlestick patterns that consist of a single candle. Inverted bullish or bearish hammers have a small real body with a long upper shadow.
Unlike the hammer, the candle’s body is at the bottom of the price range.
Color does not matter. The body can be green or red.
Bullish Inverted Hammer
The bullish Inverted Hammer candlestick is a price reversal pattern at the bottom.
When such a candle appears on the chart, wait for confirmation that the “inverted hammer” is bullish. For example, the appearance of a “green full-bodied bullish candle”. In addition, a small up gap between the “inverted hammer” and the candle following it can serve as confirmation.
The hourly XAUUSD chart below shows that after the formation of the hammer and the inverted hammer, the price rose higher and fell again to the level where the patterns were formed. Next, successive “inverted hammer” patterns can be seen. After that, a gap up was formed, and the price began to grow actively.
Thus, the bullish sentiment was confirmed in advance, which would allow opening a buy trade.
Bearish Inverted Hammer
The Bearish Inverted Hammer is a pattern that forms at the top. It signals a bearish trend reversal.
This pattern is also called a “shooting star” because it resembles a falling star with a bright trail. The formation of this pattern indicates that the bulls were trying to rise. However, this was unsuccessful, and the bears lowered the price to the candle’s opening price zone.
The picture below shows that the bulls tried to push the price higher, but then the bears stepped in and lowered the price back into the candle’s opening range.
Following the formation of this pattern, the price declined, reaching a local bottom, where bullish hammer patterns had already been formed.
Examples of Using a Hammer
Below are examples of short-term trading using different instruments according to the above patterns.
Example 1 – «Hammer»
In this case, I used a 30-minute AUDJPY chart.
The picture below shows that a bullish hammer pattern has been formed at the level of 93.791. After that, I opened a minimum buy trade with a 0.01 lot. The bullish mood in the market served as an additional signal. This can be seen from the formation of previous green candles.
I set a stop loss below the hammer candlestick formation and a take profit near the level of 94.410. In such cases, it is desirable to set take profits at the nearest resistance levels since, during intraday trading, market sentiment can change dramatically due to fundamental factors.
The signal quickly appeared, and after an hour and a half, the trade ended with a closing price of 94.36 with a profit of $4.14.
Example 2 – «The Hanging Man»
In the second case, I used a USCrude trade. On the 15-minute chart, a hanging man pattern formed after an uptrend. This served as a signal to open a short trade with a 0.01 lot.
I set a stop loss above the candle where I opened the position. Potential take profit is at the level of 109.254.
However, this trade was less successful as I opened it late, but there was a downside potential.
Thus, the trade was closed with a profit of 30% or $3.35.
Example 3 – «The Shooting Star»
The EURUSD hourly chart shows the formation of a “shooting star” pattern, which warned traders of an impending price decline.
In addition, it was clear that the sellers put pressure on the price. This is evidenced by four red candles formed in a row.
I also opened a 0.01 lot short position and placed a stop loss above 1.0600. Take profit is set at the nearest support level of 1.0499.
The trade was successfully closed manually with a profit of $3.80. The price did not reach the target by about 20 points.
Limitations of a Hammer Candlestick
Before entering a trade using the Hammer and Inverted Hammer patterns, it is important to:
-
check whether there is a support level at the place of formation of the “bullish hammer” and “inverted hammer”, as well as the level of resistance at the place of formation of the “shooting star” and “hanging man”;
-
make sure there is a small gap between the pattern itself and the nearby candles during the formation of the abovementioned patterns (not a mandatory parameter);
-
wait for confirmation of a trend reversal not only with the help of these patterns, but also with technical indicators or other candlestick patterns;
-
monitor trading volumes to determine the trend strength.
If you do not follow these rules, you may fall into a market trap from which there can be no way out.
Hammer Candlestick and a Doji
The similarities between the Japanese candles hammer and doji are listed below:
-
both are signal patterns for a trend reversal;
-
both candles have a long lower or upper wick;
-
the dynamics of price movement after their formation does not depend on the candle’s color.
The only difference is that the Doji does not have a candle body.
Conclusion
Hammers are classic reversal and rather strong patterns in technical analysis. The article provides a detailed analysis of how to identify these candles on the charts, as well as an example of live trading according to the abovementioned patterns.
You can test your abilities and copy my trades for free using a demo account with a trusted broker LiteFinance.
Hammer Candlestick Trading FAQs
The content of this article reflects the author’s opinion and does not necessarily reflect the official position of LiteFinance broker. The material published on this page is provided for informational purposes only and should not be considered as the provision of investment advice for the purposes of Directive 2014/65/EU.
According to copyright law, this article is considered intellectual property, which includes a prohibition on copying and distributing it without consent.