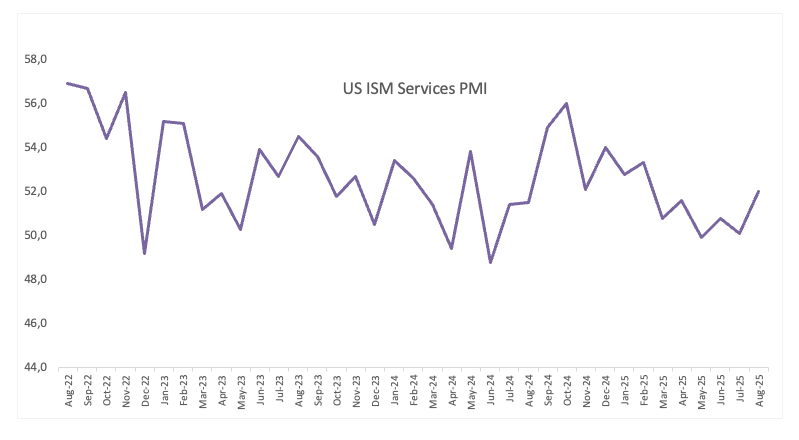
- The US ISM Services PMI unexpectedly improved in August.
- The US Dollar clings to its daily gains on Thursday.
Data from the Institute for Supply Management (ISM) showed the Services PMI rose to 52.0 in August, up from 50.1 in the previous month and exceeding analysts’ forecasts of 51.0.
Meanwhile, the Prices Paid Index—which tracks inflation—eased to 69.2 from 69.9, the Employment Index ticked a tad higher to 46.5 from 46.4, and the New Orders Index went up to 56.0, from 50.3.
The Greenback maintains its upbeat performance on Thursday, motivating the US Dollar Index (DXY) to keep its bid bias around the 98.30 zone despite the poor performance of US yields across the curve.
US Dollar Price Today
The table below shows the percentage change of US Dollar (USD) against listed major currencies today. US Dollar was the strongest against the Australian Dollar.
| USD | EUR | GBP | JPY | CAD | AUD | NZD | CHF | |
|---|---|---|---|---|---|---|---|---|
| USD | 0.14% | 0.09% | 0.33% | 0.22% | 0.39% | 0.38% | 0.24% | |
| EUR | -0.14% | -0.05% | 0.16% | 0.08% | 0.30% | 0.23% | 0.05% | |
| GBP | -0.09% | 0.05% | 0.30% | 0.13% | 0.34% | 0.29% | 0.09% | |
| JPY | -0.33% | -0.16% | -0.30% | -0.10% | 0.00% | 0.10% | -0.07% | |
| CAD | -0.22% | -0.08% | -0.13% | 0.10% | 0.14% | 0.18% | -0.03% | |
| AUD | -0.39% | -0.30% | -0.34% | -0.00% | -0.14% | -0.06% | -0.24% | |
| NZD | -0.38% | -0.23% | -0.29% | -0.10% | -0.18% | 0.06% | -0.15% | |
| CHF | -0.24% | -0.05% | -0.09% | 0.07% | 0.03% | 0.24% | 0.15% |
The heat map shows percentage changes of major currencies against each other. The base currency is picked from the left column, while the quote currency is picked from the top row. For example, if you pick the US Dollar from the left column and move along the horizontal line to the Japanese Yen, the percentage change displayed in the box will represent USD (base)/JPY (quote).
This section below was published as a preview of the US ISM Services report for August at 08:00 GMT.
- The US ISM Services PMI is expected to improve a tad in August.
- The US services sector should remain in the expansionary territory.
- Speculation of two rate cuts from the Fed this year remains on the rise.
On Thursday, we’ll get the latest read on the US services sector when the Institute for Supply Management publishes its August Services PMI. Economists think the index will tick up to 51 from July’s 50.1. If they’re right, that would be the third month in a row the sector has grown, another reminder of its staying power and a small lift for confidence in the broader economy.
Still, the details from July weren’t all upbeat. Hiring momentum slipped, with the ISM Employment Index dropping back into contraction at 46.4. New orders also lost a bit of steam, easing to 50.3, which hints that demand may be cooling. Despite the steady growth, the rising Prices Paid Index to 69.9 highlights the persistent inflation pressures.
What to expect from the ISM Services PMI report?
Inflation in the US is still running hotter than the Fed’s 2% target, and that keeps policymakers uneasy, especially with the full effects of recent tariffs yet to filter through the economy.
The latest Personal Consumption Expenditures (PCE) report underscored this point. Core inflation, which strips out food and energy, rose 2.9% YoY in July, up from 2.8% in June and a touch higher than most forecasts. Headline PCE held steady at 2.6% annually, showing little sign of easing.
Against that backdrop, an ISM Services PMI that lands in line with expectations probably won’t move the US Dollar much. It would simply confirm the picture of an economy that’s still resilient but still wrestling with sticky price pressures. A softer-than-expected print, though, could shake confidence and see investors trim their USD holdings on fears that growth is losing momentum.
When will the ISM Services Purchasing Managers Index report be released, and how could it affect EUR/USD?
The Institute for Supply Management (ISM) will publish the Services Purchasing Managers Index (PMI) on Thursday at 14:00 GMT.
Pablo Piovano, Senior Analyst at FXStreet, notes that renewed selling pressure could first drag EUR/USD down to a weekly floor at 1.1574 (August 27), prior to its monthly low at 1.1391 (August 1). A break below the latter, he says, would put the late-May trough at 1.1210 back on the radar.
On the flip side, if the pair regains strength, it could retest the August ceiling at 1.1742 (August 22), seconded by the late-July high at 1.1788 (July 24), with the 2025 peak of 1.1830 not far behind. Clearing that zone, Piovano argues, could open the door to a run toward the psychologically important 1.2000 mark.
Overall, he adds, as long as EUR/USD stays above its 200-day Simple Moving Average at 1.1045, the broader constructive outlook for the pair remains intact.
Inflation FAQs
Inflation measures the rise in the price of a representative basket of goods and services. Headline inflation is usually expressed as a percentage change on a month-on-month (MoM) and year-on-year (YoY) basis. Core inflation excludes more volatile elements such as food and fuel which can fluctuate because of geopolitical and seasonal factors. Core inflation is the figure economists focus on and is the level targeted by central banks, which are mandated to keep inflation at a manageable level, usually around 2%.
The Consumer Price Index (CPI) measures the change in prices of a basket of goods and services over a period of time. It is usually expressed as a percentage change on a month-on-month (MoM) and year-on-year (YoY) basis. Core CPI is the figure targeted by central banks as it excludes volatile food and fuel inputs. When Core CPI rises above 2% it usually results in higher interest rates and vice versa when it falls below 2%. Since higher interest rates are positive for a currency, higher inflation usually results in a stronger currency. The opposite is true when inflation falls.
Although it may seem counter-intuitive, high inflation in a country pushes up the value of its currency and vice versa for lower inflation. This is because the central bank will normally raise interest rates to combat the higher inflation, which attract more global capital inflows from investors looking for a lucrative place to park their money.
Formerly, Gold was the asset investors turned to in times of high inflation because it preserved its value, and whilst investors will often still buy Gold for its safe-haven properties in times of extreme market turmoil, this is not the case most of the time. This is because when inflation is high, central banks will put up interest rates to combat it.
Higher interest rates are negative for Gold because they increase the opportunity-cost of holding Gold vis-a-vis an interest-bearing asset or placing the money in a cash deposit account. On the flipside, lower inflation tends to be positive for Gold as it brings interest rates down, making the bright metal a more viable investment alternative.
GDP FAQs
A country’s Gross Domestic Product (GDP) measures the rate of growth of its economy over a given period of time, usually a quarter. The most reliable figures are those that compare GDP to the previous quarter e.g Q2 of 2023 vs Q1 of 2023, or to the same period in the previous year, e.g Q2 of 2023 vs Q2 of 2022.
Annualized quarterly GDP figures extrapolate the growth rate of the quarter as if it were constant for the rest of the year. These can be misleading, however, if temporary shocks impact growth in one quarter but are unlikely to last all year – such as happened in the first quarter of 2020 at the outbreak of the covid pandemic, when growth plummeted.
A higher GDP result is generally positive for a nation’s currency as it reflects a growing economy, which is more likely to produce goods and services that can be exported, as well as attracting higher foreign investment. By the same token, when GDP falls it is usually negative for the currency.
When an economy grows people tend to spend more, which leads to inflation. The country’s central bank then has to put up interest rates to combat the inflation with the side effect of attracting more capital inflows from global investors, thus helping the local currency appreciate.
When an economy grows and GDP is rising, people tend to spend more which leads to inflation. The country’s central bank then has to put up interest rates to combat the inflation. Higher interest rates are negative for Gold because they increase the opportunity-cost of holding Gold versus placing the money in a cash deposit account. Therefore, a higher GDP growth rate is usually a bearish factor for Gold price.