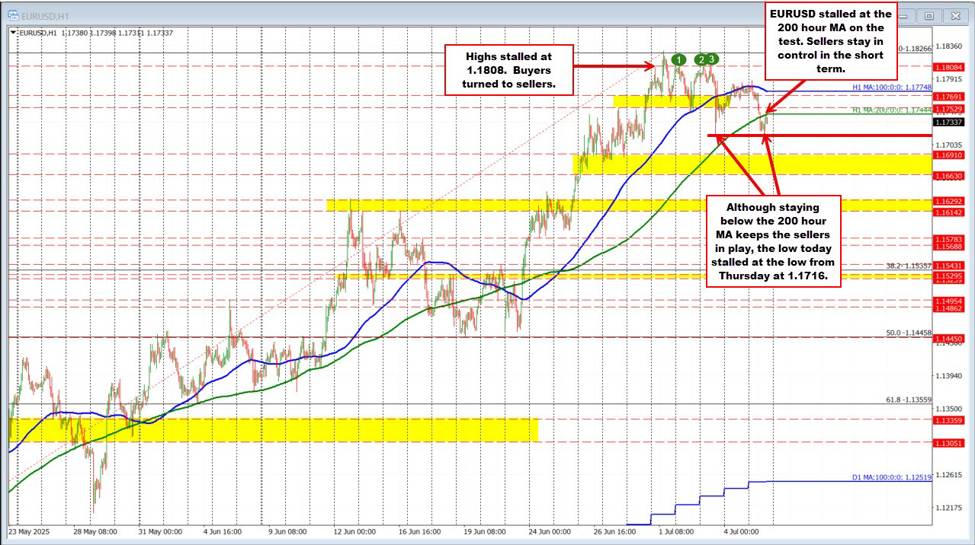
EURUSD technicals
The EURUSD reached its highest level since September 2021 last week, peaking at 1.18266. However, attempts to extend beyond that high faded, with momentum stalling on Thursday near Tuesday’s peak (see green circles). That shift in tone turned buyers into sellers, pushing the pair below the 100-hour moving average and down to a low of 1.1718.
A modest rebound followed, with the price testing the 100-hour MA on Friday and again early today. Both times, sellers leaned against the level. The pair has since moved back below the 200-hour MA, currently at 1.1744. Notably, though, sellers have yet to break the Thursday low at 1.1718, which remains a short-term support.
The price has bounced back toward the 200-hour MA, where sellers have again stalled the upside. As long as the pair stays below this level, the bearish bias holds. A break below 1.1718 would open the door for a move toward the 1.1663–1.1691 area—an important zone of prior support and resistance dating back to 2021 (see daily chart below). A move below that zone could signal stronger downside momentum ahead and give sellers more confidence..
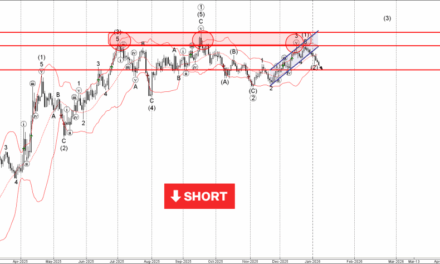
EURUSD technicals on the daily chart.
ForexLive.com
is evolving into
investingLive.com, a new destination for intelligent market updates and smarter
decision-making for investors and traders alike.