The ADP report came in weaker than expected and the US dollar has reacted to the downside.
Yields of also moved lower with the 10 year now down -4.4 basis points at 4.103%. Recall that at the cycle lows on September 17 (the day of the FOMC rate cut), the yield moved just below the 4.0% level to 3.992%.
What are some of the technical levels for so the major currency pairs now?
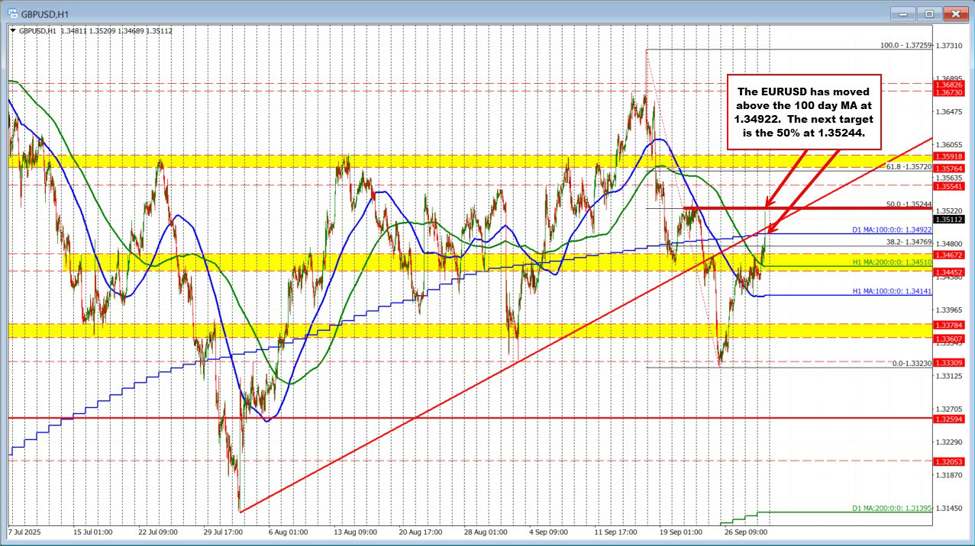
EURUSD: The EURUSD spiked above its 100-day moving average at 1.34922. Last week, the price moved back above its 100-day moving average as well, but could not sustain momentum. The next target is the 50% midpoint of the move down of the September trading range. That level comes in at 1.35244. Getting and staying above that level should open the door for further upside momentum.
USDJPY: The USDJPY als0 fell to a new low and is currently testing the low of a swing area between 146.55 and 146.803. Just below that level is the rising 100-day moving average at 146.47. Looking at the hourly chart, most of the trading range has been between 146.14 and 148.819. Just yesterday – and on Monday too – the high price stalled at 148.819. Now the price is getting closer and closer to the low of that trading range (see the red box on the chart below).
GBPUSD: The GBPUSD – like the EURUSD – spiked above the 100-day MA at 1.34925. The next target is the 50% of the September trading range at 1.35244. The 100-day MA is now close risk. Yesterday, the price of the GBPUSD stayed between the 100-hour MA and the 200 hour MA (lower blue and green lines on the chart below). Today, the price moved above the higher 200-hour MA and then based at the level before moving higher.
While the EURUSD, USDJPY and GBPUSD are trading to new USD lows (at least for the day). The USDCAD and USDCHF have different stories technically.
USDCHF: The USDCHF moved lower in early trading but quickly rebounded after failing on a break of swing area support between 0.7938 and 0.7947. The subsequent move to the upside saw the price spike higher through the 200-hour MA at 0.7956 (Green line on the chart below) and the 100-hour MA at 0.7974 (blue line on the chart below). The rally stalled at 0.7987, just inside the lower edge of a swing area between 0.7986 and 0.7994, before a weaker-than-expected ADP report pushed the pair back down to the 200-hour MA, where buyers again stepped in. The price has since bounced back to the 100-hour MA at 0.7974, leaving the pair caught in a tug-of-war between the 100- and 200-hour moving averages. The battle will be resolved on a break of either moving average level. Look for momentum in the direction of the break.
USDCAD: The USDCAD is holding near the highs and trading above a key 4-hour swing area between 1.38917 and 1.3904, a zone that previously saw failed breakouts on August 21–22 and resistance reestablished on September 11 and 24. Last week’s move above that barrier has since held firm, with multiple retests earlier this week confirming it as support and keeping buyers in control. On the upside, resistance sits at this week’s high of 1.39388, followed by last week’s peak at 1.3957 and the falling 200-day moving average at 1.3966, which must be broken to strengthen the bullish bias. On the downside, a drop back below 1.38917 would shift focus toward support at 1.3878 and then the rising 100-bar moving average on the 4-hour chart at 1.3846. For now buyers are in control.