Three Outside Up and Three Outside Down chart patterns signal a shift in the prevailing trend. Both patterns consist of three candlesticks that form under certain conditions, depending on the type of pattern: bullish or bearish.
These three-candle reversal patterns are powerful tools for expanding a trader’s horizons and increasing their profits. This article provides a comprehensive overview of these patterns, accompanied by illustrative examples drawn from real trading experiences. You will also gain insight into the key advantages and disadvantages of using these triple candlestick patterns.
The article covers the following subjects:
Major Takeaways
- Three Outside Up and Three Outside Down are strong price action patterns in technical analysis. Thanks to their distinct shapes, they are easy to spot on the chart.
- The patterns appear rarely, but their high reliability offsets this drawback. Trades can be opened near support and resistance levels, confirming trading signals with other technical indicators.
- Three Outside Up is a bullish formation, while Three Outside Down is a bearish one. Therefore, in the first case, an upward market movement is probable, and in the second case, a downward movement is projected.
- The pattern consists of three candlesticks: the first candle continues the current trend; the second candle overlaps the first one in the opposite direction; and the third candle closes above or below the second candle, depending on the pattern type.
- A breakout of the third candlestick offers an entry point. A stop-loss order is set beyond the formation. A take-profit order is placed at a distance 2-3 times greater than the stop-loss level. You can also trade using a Three Outside pattern by establishing a take-profit at a key level or waiting for a trend reversal and closing the position.
- This pattern offers several advantages, including its simplicity, clear formation conditions, and the ability to combine it with other indicators. Among the disadvantages are the potential for false signals, infrequency, reliance on broker quotes, and the subjectivity of signal interpretation.
Why Should Every Trader Know About Three Outside Patterns?
3 Outside Up/Down is a candlestick reversal pattern that can predict the end of a current trend and provide an entry point for trading a correction. The correction may then eventually evolve into a new bullish or bearish trend.
In the realm of technical analysis, this pattern falls under the category of Price Action. It can be found on any time frame and in any market. The higher the time frame, the longer it takes to form a signal. Notably, the pattern offers more reliable signals on higher time frames. The Three Outside Down and Three Outside Up patterns appear frequently on daily and weekly charts. They are straightforward and are suitable for both long-term and swing trading.
What is the Three Outside Up Candlestick Pattern?
The Three Outside Up is a bullish pattern. It appears at the end of a downtrend. Let’s take a closer look at its structure.
The bullish reversal pattern consists of three candlesticks:
- The first is a black candle or a red candle.
- The second is a white candle (or green) that breaks through the boundaries of the first candlestick and closes higher.
- The third is a white (green) candlestick that closes higher than the second one.
Initially, these day trading patterns were only used in the stock market, and in its classic form, the second candlestick opens with a downward gap, which gives the pattern greater strength. In the cryptocurrency market and Forex, the closing price of the first candlestick and the opening price of the second candlestick can be equal.
The reversal patterns are an extension of the engulfing pattern. The engulfing pattern consists of two candlesticks. The formation we analyze consists of three, where the third one is a confirmation candlestick.
Experienced traders may also notice that the Three Outside Up pattern resembles a Morning Star pattern. The formations are indeed similar, but they also have some differences, which we will discuss further.
How is Three Outside Up Candlestick Formed?
Unlike the Three Drives pattern that uses symmetrical price moves, the Three Outside Up pattern usually forms at the end of a downtrend and marks a looming upward price movement.
Here is a list of conditions necessary for the pattern to form:
-
There should be a bearish trend in the market.
-
The first candlestick of the pattern is bearish.
-
With the second candlestick, the price may slide even lower, but it will not necessarily reach a new low.
-
The second candlestick closes above the high of the first candlestick, suggesting that sellers have retreated and buyers have gained the upper hand.
-
The last candlestick confirms that bulls are strong, closing above the second candlestick. At this stage, market participants usually open long positions.
What does Green Three Outside Up Candlestick tell?
The green Three Outside Up pattern indicates a turning point in the market. The previous downtrend may fade, after which buyers prevail in the market. Since traders need to wait for three candlesticks to form the pattern, the signal is more reliable.
How often does Three Outside Up Candlestick occur?
The Three Outside Up bullish candlestick pattern rarely appears on charts because it requires a combination of several factors to form. However, when it does appear, it creates excellent conditions for opening a trade with a high probability of success. Another advantage is that the pattern takes a long time to form, making it easier for traders to find it on the chart.
How to Read Three Outside Up Candlestick?
So, what does the Three Outside Up candlestick pattern tell a trader? It means that the market has reached a point where bearish sentiment fades, and bulls have now gained the upper hand.
It becomes clear from the pattern's structure. Each daily candlestick has opening, high, low, and closing prices. A red candlestick body indicates a market decline and sellers' dominance, while a green one reflects growth. In other words, the color of the candlestick tells traders which market force has won at the end of the day.
The following conditions must be met to use the Three Outside Up pattern:
-
The pattern should emerge after a prolonged price decline.
-
The opening price of the second candlestick is lower than or equal to the closing price of the first candlestick.
-
The closing price of the second candlestick is higher than the opening price of the first candlestick.
-
The closing price of the third candlestick is higher than the closing price of the second candlestick.
Three-candle reversal patterns give reinforced signals as the size of the engulfing second candlestick increases. The larger the engulfing second candlestick is compared to the first bearish candlestick, the more reliable the signal is.
Now let’s examine how to trade this pattern.
After the correction of BTCUSD in February 2024, a Three Outside Up pattern formed. The first candlestick was red, the second one closed above the opening price of the first candle, and the third candle closed above the closing level of the second one. This signal led to a price increase of 23.25% over three days, with a tight stop-loss level.
How to Trade with Three Outside Up Candlestick?
For successful trading using this pattern, you need to follow these steps:
-
First and foremost, you should determine the long-term trend. This can be done using classic Dow theory, moving averages, and other indicators.
-
Wait for confirmation of the pattern and ensure it meets all the conditions. The signal should appear in a downtrend, and the pattern should consist of three candlesticks.
-
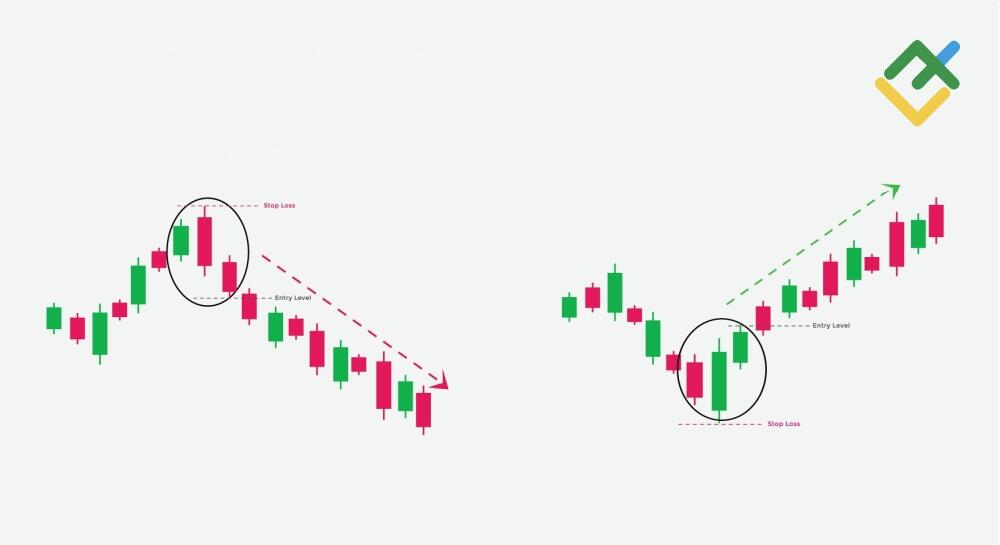
Open a long position above the high of the third candlestick after the fourth candlestick opens.
-
The purchase is made above the high of the third candlestick, as shown in the illustration below. A stop-loss order is set below the pattern. A target level depends on your goals, and a take-profit is not set in advance.
-
Lock in profits after the price reaches a risk-to-profit ratio of 1:2 or based on a predetermined percentage. You can also wait until the trend starts to reverse.
-
You can trade the Three Outside pattern near a strong support level to make your trade more secure.
-
Use additional technical analysis tools and the best technical indicators that can reveal entry points, like the RSI, MACD, Divergence, Volume, etc.
Advantages and Disadvantages of Three Outside Up Candlestick Pattern
Like any candlestick pattern, the Three Outside Up and Down patterns have their advantages and disadvantages. Let’s take a look at the main ones.
|
Advantages |
Disadvantages |
|
It can be applied to any time frame. One candlestick represents the asset’s price change over a certain period, so you can find this pattern on any time frame from M1 to MN. The pattern will look the same regardless of the time frame used. |
Not always accurate. From time to time, the pattern may generate false signals. |
|
Gives clear information. Candlestick charts show the market situation as it is, without any distortions caused by other indicators. |
The need to identify trends. You need to identify a trend to trade using the pattern, which complicates the trading process. |
|
Simplicity. The pattern consists of three candlesticks. All a trader needs to do is pay attention and check the candlesticks for compliance with the conditions. |
Dependence on quote accuracy. Depending on the broker, quotes for financial instruments may differ. A situation may arise where a pattern is formed based on your broker’s quotes, but not based on another broker’s quotes. |
|
Compatibility with indicators. Indicators, such as oscillators, complement the analysis. |
Gaps. Gaps can make entry points less effective. |
What is Three Outside Down Candlestick Pattern?
The Three Outside Down candlestick pattern is the opposite of the Three Outside Up pattern. This formation typically emerges at the uptrend’s peak, assuming that a reversal is looming. The setup also consists of three candlesticks: a green candlestick followed by two red ones. Let’s examine the structure of the pattern.
The trading pattern consists of three candlesticks:
-
The first candlestick is white or green.
-
The second candle is black or red. It breaks through the low of the first candlestick and closes below it.
-
The final candlestick is also black or red and closes below the second candlestick.
The Three Outside Down reversal pattern is an extension of the engulfing pattern. Experienced traders may notice similarities with the Evening Star candlestick pattern, but there are differences, which we will discuss in more detail later.
How is Three Outside Down Candlestick Formed?
The Three Outside Down pattern usually appears at the end of an uptrend and indicates an impending downward price movement.
The conditions for its formation are the following:
-
The price should trade in an uptrend.
-
The first candlestick is green, as if the market continues its uptrend.
-
On the second candlestick, the price may try to update the high of the first one, but not necessarily. Its reversal occurs below the low of the first candlestick; the closing price should be lower. This indicates that buyers have surrendered and sellers have seized control of the situation.
-
The last red candlestick confirms the strength of the bears. It closes below the second candlestick. At this stage, market participants who have been watching from the sidelines may open short trades.
What Does Red Three Outside Down Candlestick Tell?
The Three Outside Down pattern displays that the previous upward movement is running out of steam, and bears are entering the market. It also points to the possibility of a downward correction or a trend reversal. The first white candle still indicates an upward movement, but the engulfing candlestick and the subsequent confirmation candlestick point to the possibility of short selling.
How Often Does Three Outside Down Candlestick Occur?
The bearish candlestick pattern rarely appears on charts because it requires three candlesticks, unlike other setups that consist of two candlesticks. The Three Outside Down pattern can be found on stock index and stock charts. It is less frequently observed on currency and cryptocurrency charts.
At the same time, the statistical probability of the pattern’s occurrence increases due to the expectation of the right conditions for its formation. Traders identify the exhaustion of an uptrend and then observe a Bearish Engulfing pattern. The third candlestick of the pattern drags the price even lower, confirming the reversal. These are all strong signals that create opportunities for opening a position.
How to Read Three Outside Down Candlestick?
If you want to learn how to read the Three Outside Down pattern, you first need to get a handle on the main parts of a candlestick chart. Each candlestick has four important features: the opening price, the closing price, the high, and the low. It also represents a specific time interval (5 minutes, 15 minutes, 1 day, 1 week, etc.). We can analyze price performance by understanding how candlesticks interact with each other.
To find a reliable Three Outside Down pattern, the following conditions should be met:
-
The pattern should emerge after a prolonged price increase.
-
The opening price of the second candlestick is higher than or equal to the closing price of the first candlestick.
-
The closing price of the second candlestick is lower than the opening price of the first candlestick.
-
The closing price of the third candlestick is lower than the closing price of the second candlestick.
The strength of the pattern increases with the size of the second engulfing candlestick. The larger the body of the second candlestick, the stronger the downward price movement is expected to be. You should also wait for the third red candlestick to confirm the signal.
The ETH/USD chart shows that a 3 Outside Down pattern formed in June 2024. Prior to this, the price was increasing, and the pattern reversed the upward movement. After opening a sell trade, a trader could benefit from a 15% decline, with a very tight stop-loss set above the top of the formation.
How to Trade with Three Outside Down Candlesticks?
Traders need to closely monitor market developments in order to trade this pattern successfully. An upward price movement should precede the pattern. It is recommended to adhere to the following rules:
-
Identify the Three Outside Down pattern. Traders should look for a bullish candlestick followed by a large bearish candlestick that engulfs the previous one. The third candlestick should be bearish and close below the close of the second candlestick.
-
Confirm the pattern. Traders should look for confirmation of the pattern by checking other technical indicators such as the RSI, moving averages, and volume. An increase in volume during its formation is solid confirmation. The appearance of a signal near a strong support or resistance level also increases its reliability.
-
Place a sell order. Once you see that the sell pattern has formed, place a Sell Stop order below the low of the third candlestick. This setup provides a clear entry point.
-
Set a stop-loss order. Your stop-loss should be placed above the high of the pattern to limit potential losses in case the market moves against your expectations.
-
Lock in profits. Profits can be taken once the price reaches a 1:2 risk-to-reward ratio or based on a pre-determined percentage. You can place a take-profit order at a strong key level or a recent swing low.
-
Let the market do its part. Do not rush to close your position prematurely.
Advantages and Disadvantages of Three Outside Down Candlestick Pattern
The 3 Outside Down candlestick pattern is widely used in technical analysis due to its numerous advantages over other tools. The main advantages of the Three Outside are the following:
-
A strong trend reversal signal. Three candlesticks are required to form the pattern. During this time, a full-fledged battle between buyers and sellers will lead to a clear result.
-
Confirmation of market weakness. The Three Outside Down pattern confirms that the market is weakening.
-
Provides clear entry and exit signals. It tells us where to open a trade and where to place a stop-loss order.
-
Versatility. It can be used in combination with other technical indicators.
The disadvantages of the Three Outside Down include the fact that the pattern may generate false signals. It is not always reliable and often requires confirmation with indicators. In addition, the interpretation of the pattern’s signals is not always objective.
Conclusion
A triple candlestick pattern is a powerful signal to traders that the previous trend is likely to be exhausted and a reversal will follow shortly. This reversal can lead to either a small pullback or a trend reversal.
It is important for traders to master the art of trading three consecutive candlesticks because it provides lucrative entry points. Such signals usually represent a profit/loss ratio of 2/1 or higher. Why not take advantage of such a generous offer from the market?
Indeed, false signals will occur from time to time. However, there is no tool or pattern that guarantees 100% accuracy. However, trading with the Three Outside Bars will allow you to increase your capital in a fairly simple way.
3 Outside Up/Down Patterns FAQs
The content of this article reflects the author’s opinion and does not necessarily reflect the official position of LiteFinance broker. The material published on this page is provided for informational purposes only and should not be considered as the provision of investment advice for the purposes of Directive 2014/65/EU.
According to copyright law, this article is considered intellectual property, which includes a prohibition on copying and distributing it without consent.