
American consumer confidence lost momentum in early August, as households grew more pessimistic about current conditions and the broader economic outlook, according to preliminary data from the University of Michigan.
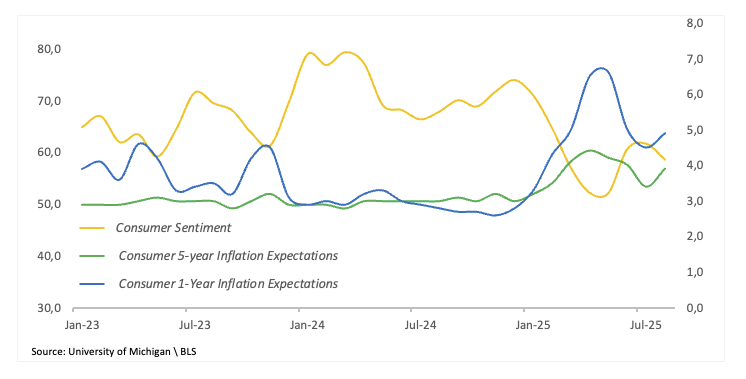
The closely watched Consumer Sentiment Index dropped to 58.6 from 61.7 in July, missing economists’ expectations and signalling a poor backdrop in public confidence.
Furthermore, the Current Conditions index fell to 60.9 from 68.0, while the Expectations gauge eased to 57.2 from 57.7, highlighting some change of view regarding the months ahead.
Inflation expectations, meanwhile, ticked higher. The one-year outlook picked up pace to 4.9% from 4.5%, and the five-year forecast increased to 3.9% from 3.4% — suggesting that consumers are seeing some gain of momentum in price pressures, in line with recent signs of stubborn inflation in official data.
Market reaction
The dollar remains well offered amid the broader choppiness seen throughout the week. That said, the US Dollar Index (DXY) navigates the sub-98.00 region in the wake of the data release, fading Thursday’s decent rebound.
US Dollar PRICE Today
The table below shows the percentage change of US Dollar (USD) against listed major currencies today. US Dollar was the strongest against the Canadian Dollar.
| USD | EUR | GBP | JPY | CAD | AUD | NZD | CHF | |
|---|---|---|---|---|---|---|---|---|
| USD | -0.54% | -0.22% | -0.63% | -0.14% | -0.40% | -0.24% | -0.32% | |
| EUR | 0.54% | 0.30% | 0.03% | 0.40% | 0.12% | 0.29% | 0.22% | |
| GBP | 0.22% | -0.30% | -0.30% | 0.10% | -0.19% | -0.02% | -0.08% | |
| JPY | 0.63% | -0.03% | 0.30% | 0.39% | 0.13% | 0.33% | 0.19% | |
| CAD | 0.14% | -0.40% | -0.10% | -0.39% | -0.22% | -0.12% | -0.18% | |
| AUD | 0.40% | -0.12% | 0.19% | -0.13% | 0.22% | 0.10% | 0.10% | |
| NZD | 0.24% | -0.29% | 0.02% | -0.33% | 0.12% | -0.10% | -0.06% | |
| CHF | 0.32% | -0.22% | 0.08% | -0.19% | 0.18% | -0.10% | 0.06% |
The heat map shows percentage changes of major currencies against each other. The base currency is picked from the left column, while the quote currency is picked from the top row. For example, if you pick the US Dollar from the left column and move along the horizontal line to the Japanese Yen, the percentage change displayed in the box will represent USD (base)/JPY (quote).
This section below was published as a preview of the preliminary print of the University of Michigan Consumer Sentiment for August at 11:00 GMT.
- US Consumer Sentiment is seen improving a tad in August.
- Investors’ attention should also gyrate around inflation expectations.
- So far in August, the US Dollar Index has remained weak.
On Friday, the US gets the first look at August’s University of Michigan Consumer Sentiment Index. This monthly survey gauges households’ perceptions of the economy’s trajectory. A final reading follows two weeks later.
The release breaks down into several measures. There’s the Current Conditions Index and the Consumer Expectations Index — plus the parts markets really watch: one-year and five-year inflation expectations.
In July, sentiment improved to a five-month high at 61.7 from May’s 52.2, which also was the lowest level since the summer of 2022. Still, on the bright side, the Current Conditions component ticked higher to 68.0, although Expectations eased to 57.7.
Inflation expectations in focus amid tariff limbo
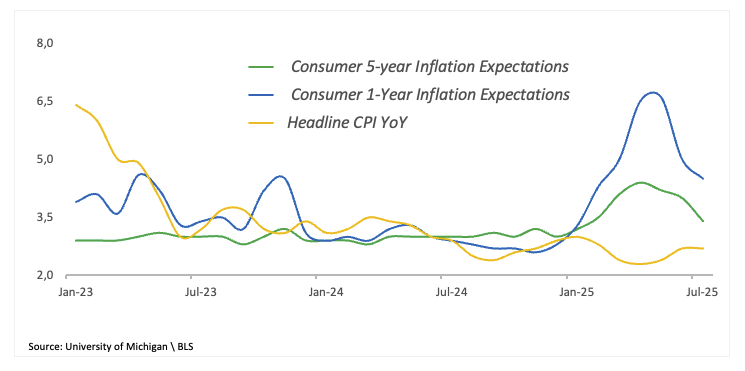
Looking closer, the one-year inflation outlook extended its downward trend in July, down to 4.5% following June’s 5.0% increase and May’s 6.6% gain, the highest level so far this year. In the longer run, the five-year gauge eased to 3.4% in July, clinching its third consecutive monthly decline.
Still, consumers seem unconvinced of a lasting pass-through of inflation-related tariffs into their daily expenses, in a context where the White House’s trade policy does not appear to be navigating in the clear either.
The U-Mich survey will land just after July’s US Inflation Rate, which showed the headline Consumer Price Index (CPI) holding steady at 2.7% from a year earlier, while the core CPI increased to 3.1% compared to the same month in 2024, reinforcing the persistence of domestic inflationary pressure and the cautious approach taken by the Federal Reserve (Fed).
How can the UoM report affect the US Dollar?
The Greenback maintains a downward trend so far in August, prompting the US Dollar Index (DXY) to slip back to the sub-98.00 region following multi-week highs north of the psychological 100.00 barrier recorded on August 1.
The US Dollar’s decline in the past few weeks has accelerated due to prospects for a couple of interest rate cuts by the Fed, likely in September and December, along with President Trump’s efforts to transform the Fed into a more dovish institution. Looking at the wider picture, the idea of a weaker currency to incentivise the country’s competitiveness has been weighing on the Greenback since “Inauguration Day”.
Senior Analyst at FX Street, Pablo Piovano, argues that if DXY clears its multi-year trough at 96.37 (July 1), the index might then challenge the February 2022 base at 95.13 (February 4), ahead of the 2022 valley at 94.62 (January 14).
In the opposite direction, the immediate barrier sits at the August ceiling of 100.25 (August 1), while a surpass of this region could pave the way for a potential visit to the weekly top at 100.54 (May 29), prior to the May peak at 101.97 (May 12).
Momentum indicators also give mixed signals: the Relative Strength Index (RSI) has dropped to around 44, suggesting the likelihood of extra losses in the near term, while the Average Directional Index (ADX) is nearing 13 and points to a weak trend.
Inflation FAQs
Inflation measures the rise in the price of a representative basket of goods and services. Headline inflation is usually expressed as a percentage change on a month-on-month (MoM) and year-on-year (YoY) basis. Core inflation excludes more volatile elements such as food and fuel which can fluctuate because of geopolitical and seasonal factors. Core inflation is the figure economists focus on and is the level targeted by central banks, which are mandated to keep inflation at a manageable level, usually around 2%.
The Consumer Price Index (CPI) measures the change in prices of a basket of goods and services over a period of time. It is usually expressed as a percentage change on a month-on-month (MoM) and year-on-year (YoY) basis. Core CPI is the figure targeted by central banks as it excludes volatile food and fuel inputs. When Core CPI rises above 2% it usually results in higher interest rates and vice versa when it falls below 2%. Since higher interest rates are positive for a currency, higher inflation usually results in a stronger currency. The opposite is true when inflation falls.
Although it may seem counter-intuitive, high inflation in a country pushes up the value of its currency and vice versa for lower inflation. This is because the central bank will normally raise interest rates to combat the higher inflation, which attract more global capital inflows from investors looking for a lucrative place to park their money.
Formerly, Gold was the asset investors turned to in times of high inflation because it preserved its value, and whilst investors will often still buy Gold for its safe-haven properties in times of extreme market turmoil, this is not the case most of the time. This is because when inflation is high, central banks will put up interest rates to combat it.
Higher interest rates are negative for Gold because they increase the opportunity-cost of holding Gold vis-a-vis an interest-bearing asset or placing the money in a cash deposit account. On the flipside, lower inflation tends to be positive for Gold as it brings interest rates down, making the bright metal a more viable investment alternative.
Economic Indicator
UoM 1-year Consumer Inflation Expectations
The University of Michigan’s Inflation Expectations gauge captures how much consumers anticipate prices will change over the coming 12 months. It comes out in two rounds—a preliminary release that tends to pack a bigger punch, followed by a revised update two weeks later.
Last release:
Fri Aug 01, 2025 14:00
Frequency:
Monthly
Actual:
4.5%
Consensus:
–
Previous:
4.4%
Source:
University of Michigan