AUDUSD Multi-Timeframe ICT & SMC Analysis (Intraday Trading Outlook)
📊 Market Overview
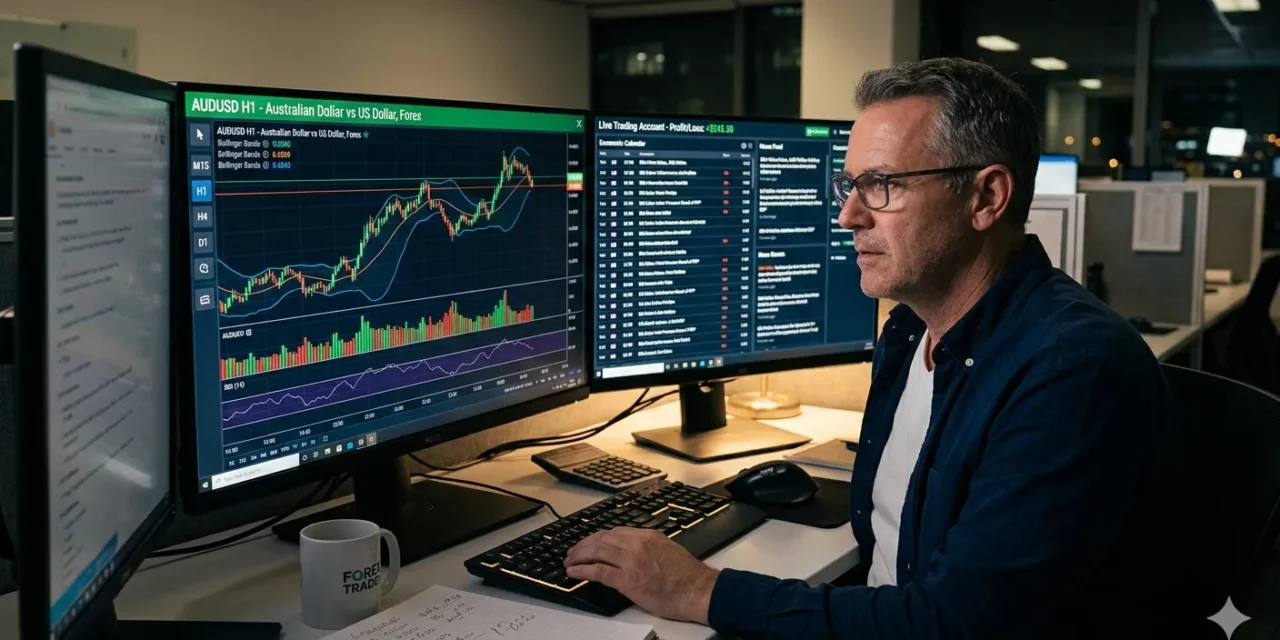
AUDUSD is currently trading around 0.7027, recovering from a sharp sell-side liquidity sweep near 0.6900–0.6920. The market has transitioned from a bearish distribution phase into a short-term bullish retracement, but is now approaching a premium supply zone, where smart money may look to re-enter short positions.
This creates a classic ICT environment:
- Higher timeframe: bullish structure still valid
- Mid-term: corrective bearish phase recently completed
- Intraday: bullish retracement into premium → potential reversal
The key narrative today revolves around:
➡️ Will price continue higher or reject from premium supply?
🟣 Daily Timeframe (Macro Bias)
The daily chart defines the long-term structure.
- AUDUSD has been forming higher highs and higher lows, indicating a bullish macro trend.
- A recent retracement into the 0.6600–0.6700 demand zone triggered a strong rally.
- Price is now consolidating below 0.7100–0.7200 supply, which acts as a major resistance.
🔑 Key Observations:
- Bullish structure intact
- Price currently in mid-to-premium range
- Weak highs exist above 0.7100
📌 Daily Bias:
➡️ Bullish overall
➡️ Expect pullbacks before continuation higher
🔵 4H Timeframe (Institutional Context)
The 4H timeframe shows a more detailed story.
- A clear liquidity sweep below 0.6920 was followed by a strong bullish reaction.
- A CHoCH to the upside confirms a shift in short-term structure.
- However, price is now approaching 4H supply near 0.7070–0.7100.
🔑 Key Zones:
- 🟦 Demand: 0.6900 – 0.6950
- 🟥 Supply: 0.7070 – 0.7100
🔍 Insight:
- Market has completed:
- Accumulation → Expansion → Retracement
- Now entering:
- Potential distribution phase at premium
📌 4H Bias:
➡️ Short-term bearish (reaction expected)
➡️ Medium-term bullish continuation likely
🟢 1H Timeframe (Execution Bias)
The 1H chart provides intraday structure.
- Price formed a bullish CHoCH after sweeping lows
- Followed by a strong impulsive move upward
- Currently consolidating below 0.7070 resistance
🔑 Observations:
- Equal highs forming near 0.7060–0.7070
- Liquidity resting above
- Internal range developing
📌 Key Levels:
- Resistance: 0.7060 – 0.7100
- Support: 0.7000 – 0.7020
📌 1H Bias:
➡️ Bullish into liquidity (short-term)
➡️ Then bearish reaction from supply
🟡 15M Timeframe (Intraday Structure)
The 15M timeframe reveals the real-time narrative.
- A strong bullish displacement from 0.6920 confirms institutional buying
- Price then created:
- Equal highs near 0.7060
- Internal CHoCH + minor BOS
🔑 Structure:
- Sell-side liquidity taken → bullish expansion → liquidity build-up
📌 Key Zones:
- 🟦 Demand: 0.6990 – 0.7020
- 🟥 Supply: 0.7060 – 0.7100
📌 15M Bias:
➡️ Bullish toward equal highs first
➡️ Then watch for reversal
🔴 5M Timeframe (Entry Precision)
The 5M chart offers sniper entries.
- Clean bullish move from demand
- Formation of intraday higher lows
- Current structure:
- Consolidation near resistance
- Potential distribution
🔑 Entry Model:
- Liquidity sweep → CHoCH → BOS → retracement → entry
🎯 High-Probability Trade Setups
🔺 Setup 1: Buy Continuation into Liquidity (Primary Setup)
🧠 Narrative:
Price has already taken sell-side liquidity and is now targeting buy-side liquidity above equal highs (0.7060–0.7070).
📍 Entry Zone:
- 0.7000 – 0.7020 (intraday demand / OTE)
🛑 Stop Loss:
- Below 0.6980
🎯 Targets:
- TP1: 0.7050
- TP2: 0.7070
- TP3: 0.7100
⚡ Confluence:
- 15M bullish BOS
- 1H liquidity target above highs
- OTE retracement zone
- Demand alignment
➡️ RR Potential: 1:3 to 1:5
🔻 Setup 2: Reversal Sell from Premium (High-Probability)
🧠 Narrative:
Once buy-side liquidity is taken above 0.7060–0.7100, expect a smart money reversal from supply.
📍 Entry Zone:
- 0.7060 – 0.7100 (supply + liquidity sweep)
🛑 Stop Loss:
- Above 0.7120
🎯 Targets:
- TP1: 0.7020
- TP2: 0.7000
- TP3: 0.6950
⚡ Confluence:
- 4H supply zone
- Equal highs liquidity
- Premium pricing
- ICT distribution model
➡️ RR Potential: 1:4+
⚖️ Alternative Scenario (Bullish Breakout)
If price:
- Breaks above 0.7100 strongly
- Holds structure with bullish BOS
➡️ Expect:
- Continuation toward 0.7150–0.7200
📌 Strategy:
- Wait for break + retest
- Avoid chasing breakout
⏰ Session-Based Strategy
🌏 Asian Session:
- Range formation
- Liquidity build-up
🇬🇧 London Session:
- Liquidity manipulation
- Possible sweep above highs
🇺🇸 New York Session:
- Expansion phase
- Reversal or continuation confirmed
⚠️ Risk Management Guidelines
- Avoid trading mid-range (0.7020–0.7040)
- Wait for:
- Liquidity sweep
- CHoCH confirmation
- Secure partial profits at liquidity targets
- Use trailing stops after displacement
🧩 Final Trading Plan
✅ Bias Summary:
- Short-term: Bullish into liquidity
- Intraday reversal: Expected from premium
- Overall: Bullish continuation after retracement
🎯 Execution Plan:
- Buy dips into 0.7000 zone
- Target 0.7060 liquidity
- Look for sell setups at 0.7060–0.7100
- Target retracement toward 0.7000
🚀 Smart Money Insight
AUDUSD is currently executing a textbook ICT liquidity cycle:
- Sell-side liquidity sweep (0.6920)
- Bullish expansion
- Buy-side liquidity targeting (0.7060)
- Expected:
- Distribution → retracement → continuation
➡️ The edge lies in:
- Buying discount
- Selling premium
- Following liquidity, not emotions
📌 Conclusion
AUDUSD presents a clean, structured intraday opportunity, combining both trend continuation and reversal setups.
Key focus areas:
- Liquidity sweeps
- Market structure shifts
- Premium vs discount execution
This is an ideal pair for ICT traders seeking precision entries and high RR setups.