USDCHF Daily Outlook — April 29, 2026 | ICT & SMC Multi-Timeframe Analysis
News context: With dollar positioning and safe-haven flows shaping the landscape, USDCHF remains a key pair to watch for liquidity-driven moves.
Macro Context: Safe-Haven Dollar Meets Safe-Haven Franc — USD Wins
USDCHF presents a fascinating dynamic on April 29: two traditional safe-haven assets pitted against each other. The Swiss Franc is broadly regarded as a flight-to-safety currency, yet today it has lost ground to the US Dollar — a signal that dollar strength is dominant enough to overwhelm even the CHF’s defensive premium. This is a meaningful macro statement. When USD can rally against CHF during a risk-off session, it speaks to genuine institutional conviction in dollar positioning, not merely relative risk-on/risk-off rotation.
From an ICT and Smart Money Concepts perspective, USDCHF is the cleanest bullish trend in today’s eight-pair session. Where USDJPY has been bullish due to carry dynamics and USDCAD has been mixed due to oil-correlated flows, USDCHF has printed new cycle highs with disciplined, structured bullish order delivery across every timeframe. The analysis below unpacks why this pair is arguably the strongest technical long setup of the day.
Daily Timeframe: New Cycle High, Bullish Momentum Confirmed
The daily candle for April 29 is a statement of trend continuation. Price opened at 0.78935, pushed to a new cycle high of 0.79162, pulled back to a session low of 0.78834 (establishing the daily SSL before buyers re-engaged), and is closing near 0.79091 — well above the session open and in the upper third of the daily range.
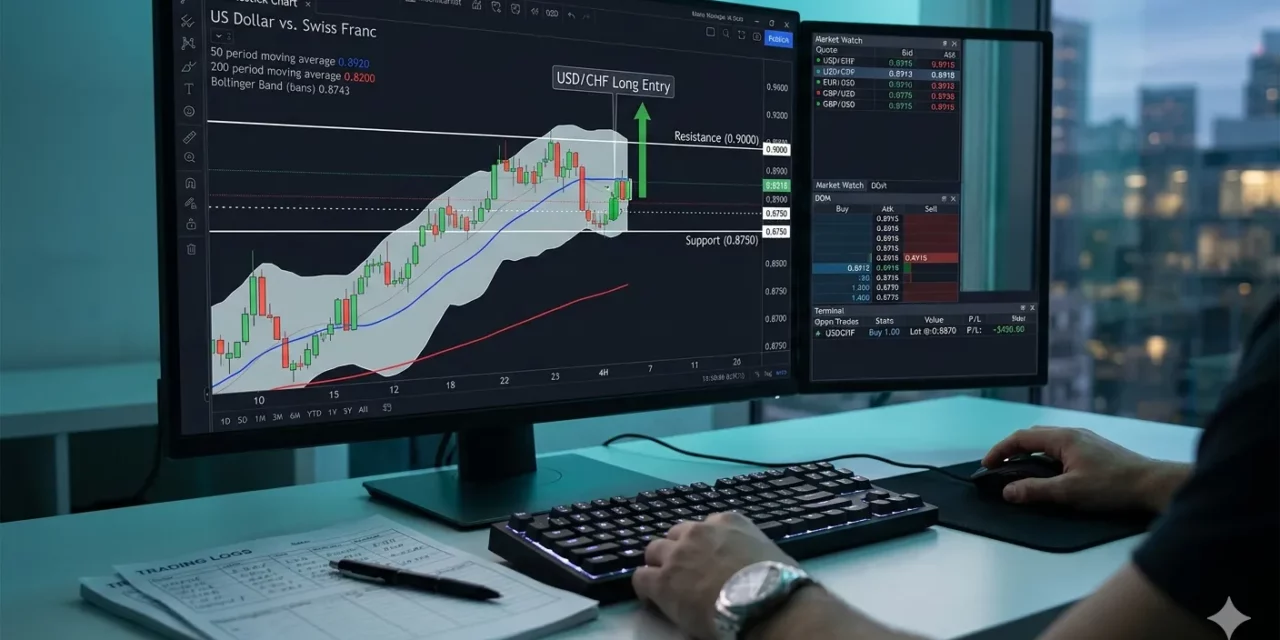
This candle structure is a bullish engulfing close above resistance — the prior multi-session high cluster near 0.79000 has now been convincingly breached on a closing basis. The close above 0.79000 is structurally decisive: it transforms a resistance level into a support zone (the breaker block concept in ICT), and positions the pair for continuation toward the next premium array.
The daily low at 0.78834 represents the daily stop hunt / SSL sweep — a classic manipulation below the prior day’s low to collect sell-stop orders before the distribution (in this case, bullish distribution — the upside delivery). The recovery from 0.78834 back to close at 0.79091 in a single session is a 257-pip reclaim, signaling strong institutional demand.
Key daily levels:
- Current cycle high / Resistance: 0.79162
- New bullish structure high: 0.79091 close
- Breaker support (prior resistance): 0.78950–0.79000
- Daily SSL swept: 0.78834
- Next daily targets: 0.79400, then 0.79700 (prior multi-month highs)
- Daily demand (if revisited): 0.78500–0.78700
The Power of Three on the daily: accumulation in the 0.78900–0.78950 range during the early session, manipulation via the 0.78834 SSL sweep below prior lows, distribution (bullish delivery) to 0.79162 during the NY killzone.
Four-Hour Timeframe: Sequential Higher Closes and Structural Dominance
The 4H chart on USDCHF is a staircase of bullish structure — sequential higher highs and higher lows throughout the day, with each 4H candle confirming the trend without meaningful counter-trend interference. The NY session 4H candle opened at 0.79013, pushed to the cycle high at 0.79162, and closed at 0.79062 — a bullish doji-like structure indicating buyers are holding gains near the high.
Prior to the NY session, the London 4H candle carried price from approximately 0.78900 through 0.79000, establishing the bullish BOS above that key psychological level. The sequence of 4H candles creates a clear bullish order flow array: each successive candle opens above the prior close, maintains above the prior open, and closes in upper quintile territory.
The 4H Bullish Order Block (the last 4H bearish candle before the impulsive bullish move) sits at approximately 0.78900–0.78960. This is the institutional long entry zone — the level where smart money was absorbing sell orders to build the bullish position that delivered the rally to 0.79162.
The 4H Bullish FVG from the most recent expansion candle sits in the 0.78980–0.79020 range. Any pullback into this zone would be absorbed by demand-side algorithms maintaining the bullish structure.
4H confluence:
- Cycle High: 0.79162
- Current 4H close: ~0.79062
- Bullish FVG: 0.78980–0.79020
- 4H Bullish OB: 0.78900–0.78960
- Next 4H target: 0.79400 (prior multi-session swing high)
One-Hour Timeframe: Pullback and Recovery Confirming Demand
The 1H chart provides the most nuanced picture of today’s intraday structure. After the NY push to 0.79162, price pulled back during the 17:00 UTC hour to 0.78960 — a retracement of approximately 202 pips from the high. This pullback tagged the 1H Bullish Order Block at 0.78950–0.78980, which is precisely where institutional demand should re-enter if the bullish trend is genuine.
The subsequent recovery from 0.78960 back to 0.79087 confirms that the pullback was a retracement into institutional demand rather than a structural reversal. The 1H CHoCH (Change of Character back to bullish) occurred when price broke above the local high at 0.79040, confirming buyers had re-established control.
Key 1H levels:
- Cycle high: 0.79162
- Current price: ~0.79087
- 1H Bullish OB: 0.78950–0.78980 (confirmed demand reaction)
- 1H BOS level (bullish): 0.79040 (price back above this)
- OTE for longs on retracement: 0.78990–0.79020 (61.8% Fib of the recovery leg)
Fifteen-Minute Timeframe: Constructive Bullish Consolidation
The 15-minute chart shows a high-quality bullish structure. After the pullback to 0.78960, the recovery leg has been printing higher lows: 0.78960 → 0.78985 → 0.79010 → 0.79040 → 0.79087. This ascending structure of higher lows is a constructive bullish pattern — each corrective dip is being bought at a higher level, indicating accumulated demand just below the current price.
The 15-minute Bullish FVG from the recovery impulse sits at 0.79020–0.79045. Any pullback into this zone during the upcoming Asian session represents a precision long entry aligned with all higher-timeframe structures.
The 15-minute structure shows no signs of bearish CHoCH — meaning no lower low has developed, and the trend remains pristinely bullish on this timeframe. A clean close below 0.79040 would be the first warning signal; a close below 0.78960 would invalidate the intraday bullish scenario.
Five-Minute Timeframe: Grind Higher and Entry Precision
The 5-minute chart shows USDCHF in a steady, disciplined grind higher from the 0.78994 level, through 0.79072, toward the current 0.79085+ area. Unlike the sharp displacement moves seen on AUDUSD or the aggressive spikes in USDJPY, USDCHF’s advance on the 5-minute timeframe is smooth and methodical — the signature of patient institutional accumulation rather than reactive retail momentum.
The 5-minute micro-structure is making higher lows at each correction: 0.79045, 0.79060, 0.79072. Sellers are unable to push price below these ascending lows, indicating that buy orders are being systematically placed at higher price levels.
Key 5-minute levels:
- 5min Bullish OB: 0.79055–0.79070 (last bearish micro-candle before impulse)
- Current price: ~0.79087
- Micro target: 0.79120 (just below cycle high)
- Cycle high: 0.79162
Sessions to monitor:
- Tokyo open: USDCHF often consolidates during Tokyo. A dip to 0.79020–0.79045 would be the ideal long entry window.
- London open (07:00 UTC): If CHF weakness persists (driven by SNB policy divergence), London could deliver the next leg toward 0.79400.
ICT Killzone Analysis
Today’s USDCHF bullish structure was established primarily during the London Killzone (07:00–09:00 UTC), which delivered the initial breakout above 0.79000. The New York Killzone (13:00–16:00 UTC) then provided the expansion leg to 0.79162, the new cycle high.
This sequence — London accumulation, NY distribution (bullish delivery) — is the canonical ICT daily structure. It means the institutional agenda for USDCHF was established at the London open and executed with precision through the NY session.
For tomorrow, the London Killzone will again be the primary window to watch. If the USD macro theme continues (and there is no major CHF-positive catalyst from the SNB), London could initiate the next push toward 0.79400.
Trade Setup Analysis
Primary Setup — Long from 15-Minute FVG Pullback
| Parameter | Level |
|---|---|
| Entry Zone | 0.79020–0.79045 (15min Bullish FVG / OTE) |
| Stop Loss | 0.78940 (below 1H Bullish OB) |
| Take Profit 1 | 0.79162 (cycle high) |
| Take Profit 2 | 0.79400 (next 4H resistance) |
| Risk-Reward | ~1:2.8 to TP2 |
| Trigger | 15min bullish close from 0.79020–0.79045 after pullback |
Rationale: The 15-minute FVG at 0.79020–0.79045 sits inside the 1H OTE zone and above the 1H bullish OB. This is the highest-conviction long entry: multiple timeframe confluence, defined risk below structural demand, and two clean targets above.
Secondary Setup — Long on Cycle High Break-and-Retest
| Parameter | Level |
|---|---|
| Entry Zone | 0.79150–0.79170 (post-breakout retest of 0.79162) |
| Stop Loss | 0.79080 |
| Take Profit 1 | 0.79280 |
| Take Profit 2 | 0.79400 |
| Risk-Reward | ~1:2.4 |
| Trigger | 1H close above 0.79162 then retest of breakout level |
Rationale: A confirmed 1H close above the cycle high at 0.79162 would trigger a new bullish BOS and invite aggressive buyers. A retest of the breakout level with bullish confirmation is a classic ICT entry on the expansion leg.
Counter-Trend Setup — Short from Daily High Retest (Low Probability)
| Parameter | Level |
|---|---|
| Entry Zone | 0.79150–0.79170 (cycle high zone) |
| Stop Loss | 0.79250 |
| Take Profit | 0.78980–0.79020 |
| Risk-Reward | ~1:1.8 |
| Trigger | Bearish 1H engulfing from 0.79162 with bearish CHoCH on 15min |
Rationale: This is a mean-reversion short from the cycle high — only valid if price shows clear bearish rejection with structural confirmation. Given the strength of the bullish trend, this is a low-probability setup and should only be considered with reduced position size and strict management.
Confluence Level Map
| Zone | Level | Timeframe | Significance |
|---|---|---|---|
| Cycle High / Resistance | 0.79162 | Daily/4H | New structural high |
| Current Price | ~0.79087 | Live | — |
| 15min Bullish FVG | 0.79020–0.79045 | 15min | Primary long entry |
| 4H Bullish FVG | 0.78980–0.79020 | 4H | Secondary long entry |
| Breaker / Prior Resistance | 0.78950–0.79000 | Daily | Now support |
| 1H Bullish OB | 0.78950–0.78980 | 1H | Confirmed demand zone |
| 4H Bullish OB | 0.78900–0.78960 | 4H | Macro demand |
| Daily SSL Swept | 0.78834 | Daily | Manipulation low |
| Daily Demand | 0.78500–0.78700 | Daily | Macro support |
| Next Bullish Target | 0.79400 | 4H/Daily | Expansion TP |
Summary Outlook
USDCHF is the counterpart to the day’s bearish risk theme — the cleanest, most structurally defined bullish trend among all eight pairs analyzed today. The daily new cycle high at 0.79162, the sequential 4H bullish closes, the textbook 1H pullback-and-recovery from the bullish OB, and the grinding 5-minute ascent all tell the same story: institutional buyers are in control, and they are methodically delivering price into a premium area above 0.79000.
The pair has effectively broken through the key 0.79000 psychological resistance on a closing basis, converting it into support. The path of least resistance is higher, with 0.79162 as the immediate ceiling to clear and 0.79400 as the next meaningful target. In the context of today’s macro theme — USD strength, CHF weakness relative to USD — USDCHF long remains one of the highest-quality setups in the forex complex.
With all eight pairs now analyzed, today’s session paints a coherent picture: the US Dollar is the dominant currency, expressing strength against AUD, EUR, GBP, and CHF, while the JPY weakness story runs parallel through USDJPY and GBPJPY. Traders aligned with this macro theme — short AUD, short EUR, short GBP, long USD — are positioned with the dominant institutional flow. Those trading against it face the full weight of today’s order delivery.
Related Forex Analysis
Compare with usdchf previous outlook, USDJPY daily outlook, and AI forex trading guide.


